Market Data July 16, 2021

How Popular is Colorado?

Here’s an interesting stat based on the most recent U.S. Census.

(although you probably won’t be surprised to hear this)

Since 1990, Colorado’s rate of population growth is double the Nation’s rate of population growth.

Here are the numbers since 1990:

30.3% growth in the U.S.
62.3% growth in Colorado

So, the Nation grows at roughly 1% per year and Colorado grows at roughly 2% per year.

It appears Colorado is twice as popular as compared to the Nation as a whole.

Market Data April 6, 2021

Interest Rate Predicition!?!

Windermere’s Chief Economist, Matthew Gardner has made his new mortgage interest rate prediction for 2021.


You can see his breakdown of interest rates and other economic factors by clicking on the image below and watching his newest video.


By the end of the year he predicts rates will rise to 3.63%.  By the end of the 3rd quarter, he sees rates at 3.48%.


This would be a 0.5% increase by year-end compared to today.


What this would mean for home buyers is a 5% higher monthly payment compared to today.

EconomicMarket Data October 28, 2020

Housing and Economic Update

In this episode Windermere Chief Economist Matthew Gardner dives into three of the latest housing market data releases and gives context to their historical significance.

Troutman Park October 21, 2020

Troutman Park Real Estate Market Update Q3 2020

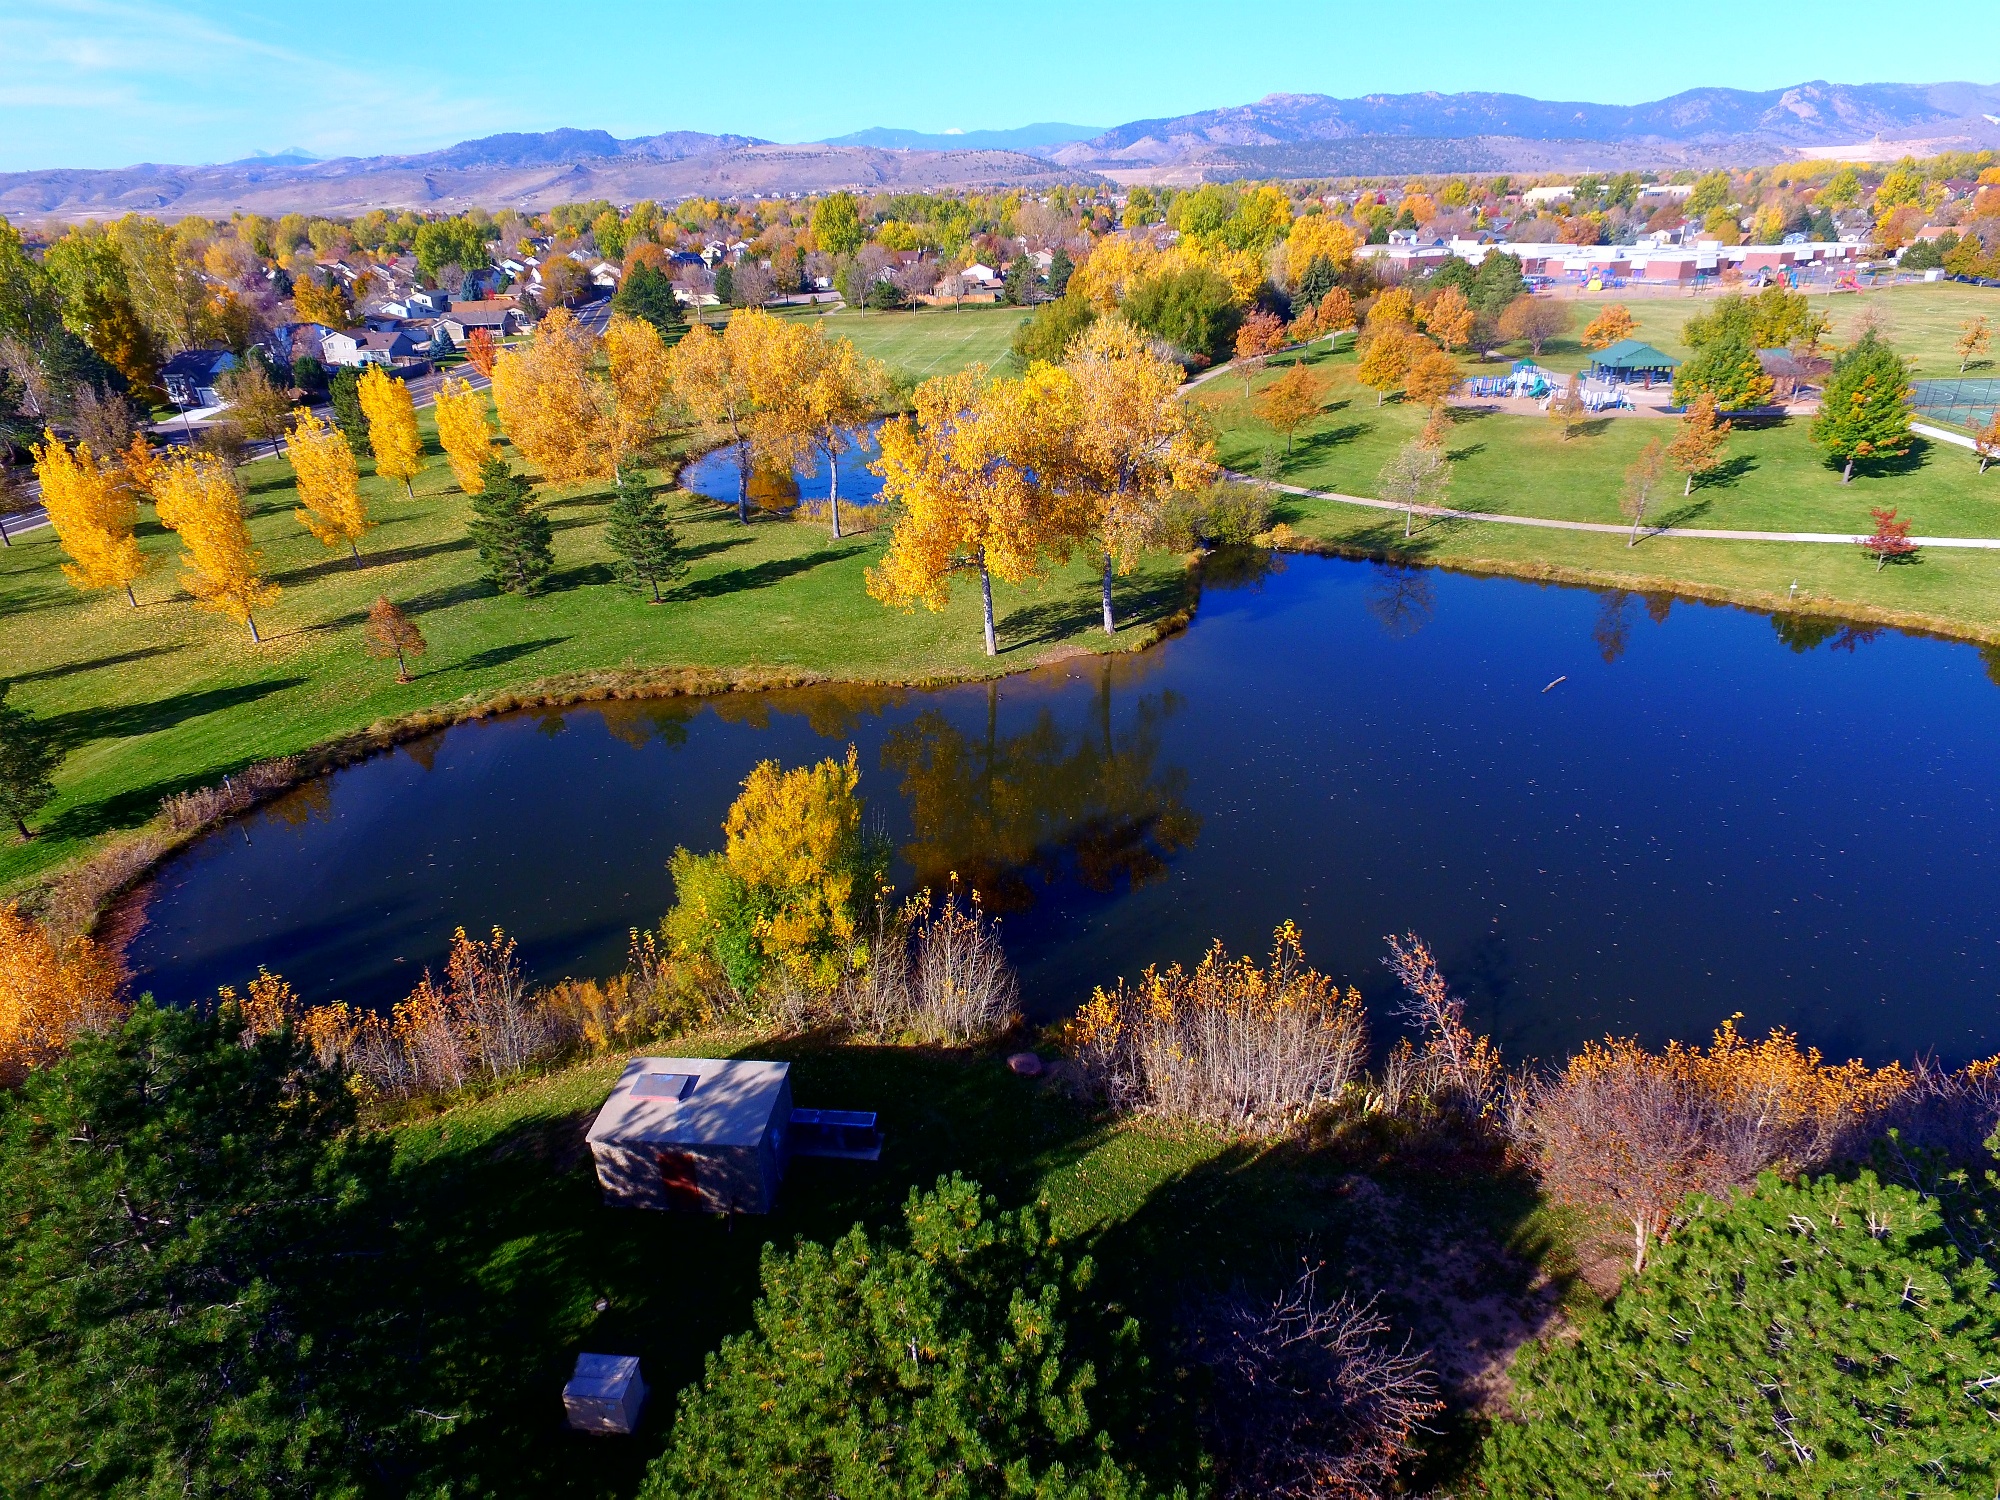
Now that we’ve made it through the 3rd Quarter of 2020 it’s time to look back and see how Troutman Park’s Real Estate market has performed compared to other recent years. Earlier in the year many felt like property values would decline like so many other investments did through all the Covid-19 adjustments. If you own a home in the Troutman Park area you’ll probably be happy to see that we’ve actually fared quite well though.

In Northern Colorado we typically see the market take a little bit of a seasonal breather during the 3rd quarter of the year as families put their home search on pause to get ready for back to school. This year has been a little different though as we saw our neighborhood’s real estate sales accelerate significantly from July through September.

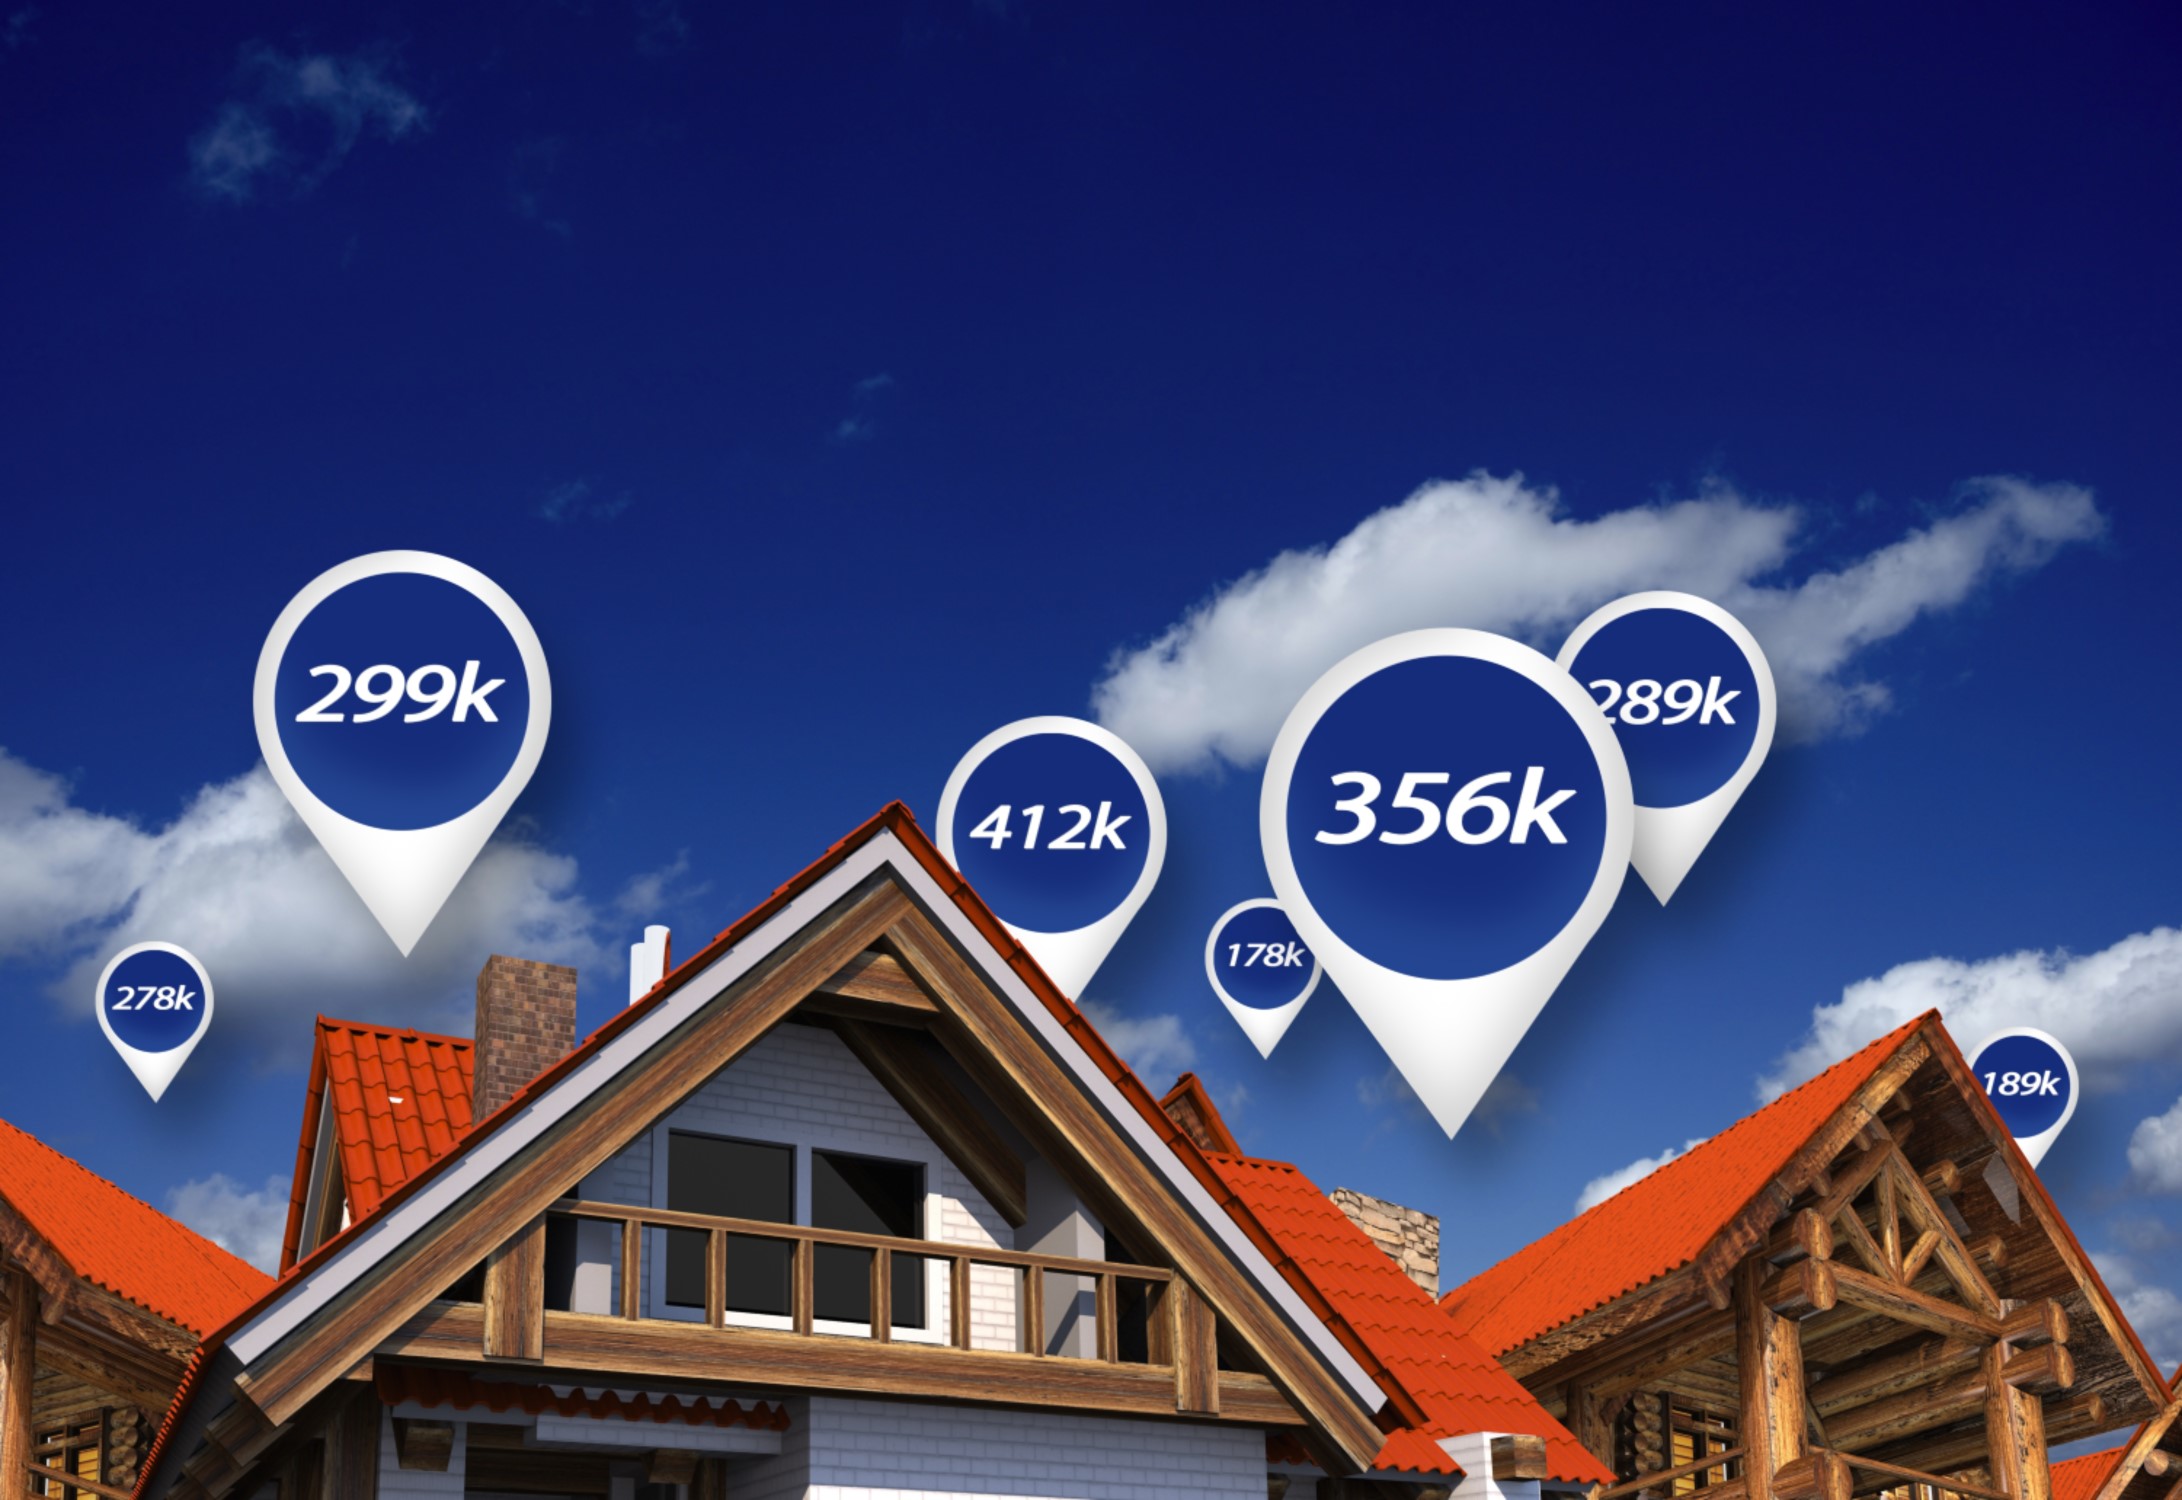
Here are the numbers compared to the 3rd Quarter of recent years:

2020 Q3 – 27 homes sold for $11,109,356. They ranged from $340,200-$480,000 at an average of $411,457

2019 Q3 – 19 homes sold for $7,555,400. They ranged from $300,000-$494,500 at an average of $397,652

2018 Q3 – 17 homes sold for $6,043,650. They ranged from $290,000-$449,500 at an average of $355,508

2017 Q3 – 18 homes sold for $6,290,750. They ranged from $296,000-$429,900 at an average of $349,486

2016 Q3 – 19 homes sold for $6,288,000. They ranged from $260,000-$405,000 at an average of $330,947

It is noteworthy to point out that the 1st two Quarters of 2020 only saw 2 more sales in our neighborhood than the 3rd Quarter!

If you have questions about Real Estate I’m always happy to share what I know. I grew up here in Fort Collins, I’ve worked in Real Estate since 2002 and live right here in Troutman Park so feel free to reach out if you ever have questions.

Market Data October 6, 2020

Chief Economists Economic Update

Event Invitation

Exclusive Invitation!!!

Tune in on Tuesday, October 6, 2020 at 9:00am to meet with Matthew Gardner, Windermere Real Estate’s Chief Economist LIVE and get your chance to ask him questions. He’ll be discussing the housing market, employment and the effects of COVID-19 on the local and national economy.

As one of the only real estate companies in the US that has a Chief Economist on staff, we have exclusive insights into the housing market, economy and government happenings. This is a one of a kind event for clients and friends of Windermere Real Estate in Colorado.

To sign up, please register at: https://attendee.gotowebinar.com/register/6400354351666419467

(If you can’t attend live, you can register to automatically get the recording.) If you miss it and would like me to send you a copy afterwards feel free to reach out!

Market Data October 6, 2020

Latest NoCO Real Estate Stats

Wooden Bridge Through Autumn Woods

We just completed a review of the September numbers in our market.

Here is the one number that is standing out to us – average price.

Prices are way up over last year.  Here are the specific average price increases in each of our markets compared to September 2019:

  • Metro Denver = 13.2%
  • Larimer County = 16.9%
  • Weld County = 7.4%

This change in prices has of course generated questions from our clients.

To help our clients answer questions about prices and other real estate topics, we have set up a private online event with our Chief Economist Matthew Gardner.

The event is set for Tuesday from 9:00 to 10:00.

Here is the registration link: https://attendee.gotowebinar.com/register/6400354351666419467

Matthew will be addressing these questions as well as many others:

  • What effect will the election have on the economy and on real estate?
  • How long can interest rates stay this low?
  • Can prices keep appreciating at their current pace?

This online event is for the clients and friends of Windermere.  If you would like more information feel free to reach out!

Market Data September 29, 2020

Northern Colorado Real Estate Market Update


The following analysis of the Metro Denver & Northern Colorado real estate market is provided by Windermere Real Estate Chief Economist Matthew Gardner. We hope that this information may assist you with making better-informed real estate decisions. For further information about the housing market in your area, please don’t hesitate to contact your Windermere agent. 


ECONOMIC OVERVIEW

COVID-19 had significant negative impacts on employment in Colorado. The pandemic caused the loss of over 342,000 jobs in March and April as unemployment rose to 12.2%. For comparison, peak unemployment following the Great Recession was 8.9%. However, it appears as if the massive contraction in employment is behind us (at least for now). Employment in Colorado rose in May by 68,800 jobs, a monthly increase of 2.8%, pushing the unemployment rate down to 10.2%. Regionally, the Denver metro area added 18,600 jobs in May and the Fort Collins metro area added 3,500 jobs. It is certainly too early to say that we are out of the woods, but we seem to be headed in a positive direction. Colorado’s COVID-19 infection rates started increasing again in June, which could slow down the economic recovery. However, I do not believe that it is likely to have any substantial impact on the housing market.


HOME SALES

  • In the second quarter of 2020, 9,867 homes sold. This represents a drop of 20.7% compared to the second quarter of 2019, but sales were 7.4% higher than in the first quarter of this year.
  • Sales dropped across all markets compared to the second quarter of 2019. I do not find this concerning as the drop can be attributed to limited supply and COVID-19.
  • Inventory levels remain tight, with the average number of homes for sale in the quarter down 21.3% from the same period in 2019. However, listings were up an impressive 15.6% over the first quarter of 2020.
  • I was pleased to see total pending sales in the quarter increase 16.3% compared to the first quarter, suggesting closing data for the third quarter will be better than we are currently experiencing.


HOME PRICES

  • Home prices held steady compared to the second quarter of 2019 at an average of $480,831. Prices were up 0.7% compared to the first quarter of this year.
  • Interest rates remain at very low levels and will stay in the low 3% range for the balance of the year, if not longer. This can allow prices to pick back up.
  • Price growth across the region was varied. Seven counties saw price growth and five experienced a drop in average sale price. Clear Creek County again saw prices rise substantially. However, as you are likely aware, it is a very small market and subject to wild swings. Prices dropped most in the equally small Gilpin County.
  • I am still watching affordability in many Colorado markets and will take this temporary “pause” as a good thing.

DAYS ON MARKET

  • The average number of days it took to sell a home in the markets contained in this report dropped by only one day compared to the second quarter of 2019.
  • The amount of time it took to sell a home dropped in eight counties, remained static in one, and rose in three compared to the second quarter of 2019.
  • It took an average of 29 days to sell a home in the region.
  • The Colorado housing market is demonstrating solid demand, and listing activity is trending higher. I expect that the summer market will be brisk.

CONCLUSIONS

This speedometer reflects the state of the region’s real estate market using housing inventory, price gains, home sales, interest rates, and larger economic factors.

Demand appears to be returning, which—combined with historically low interest rates—should lead to a brisk summer housing market. Assuming that the state gets new infection rates under control, I do not see why the housing market wouldn’t perform well this summer. As such, I have moved the needle just a little more in favor of home sellers.


EconomicMarket Data July 22, 2020

Consumer Confidence in Housing Survey

This week Chief Economist, Matthew Gardner, dives into the most recent National Housing Survey results which tell us a lot about consumer confidence both pre- and post-COVID and whether or not they feel this is a good time to buy or sell a home. The results might surprise you.

Market Data July 22, 2020

Housing Numbers needed for CO

It’s interesting to look at what population growth means for housing. On average, along the Front Range, 2.5 people live in each housing unit.

What that means is 4 housing units are needed for every 10 people who live here. So, for every 1000 new people moving to our area, 400 new housing units are required.

The population of Metro Denver is just under 3,000,000 and the population of Northern Colorado is just over 650,000.

Assuming the Front Range grows in population at 2% per year, that means 60,000 new people in Metro Denver and 13,000 new people in Northern Colorado each year.

To house those people, 24,000 new housing units need to be built per year in Metro Denver and 5,200 in Northern Colorado.

Community July 16, 2020

Buying With your Pets in Mind!

Image source: Canva


For many of us, pets play a central role in our home life, so taking into account what is best for them when buying a home is important for both their happiness and that of your entire household.


Your neighborhood


When looking for homes that are well suited to both you and your furry companion, consider the area surrounding the home. If your pet is an indoor/outdoor animal, it’s important to examine the hustle and bustle of the neighborhood. If your pet spends time outside, a busy neighborhood could be dangerous, and depending on the level of traffic, he or she may need to be on a leash at all times.


How conducive is the neighborhood for taking your pet on walks? If you frequently walk your pet, look for neighborhoods with sidewalks. If your pet enjoys being off-leash, consider prioritizing homes with green belts, parks, trails, or designated off-leash areas nearby. It’s also a good idea to identify where the local emergency pet centers and veterinarian clinics are to insure there is sufficient medical care for your pet in proximity to where you live.


Your House


  • Size: Is the house big enough? Depending on the type of pet, or breed of animal, space may be the most important factor in picking a pet-friendly home. If you are moving into a bigger space than you were in previously, understand your pet will likely take to the additional room differently. On the flip side, if you are downsizing, be mindful of how it might impact your pet.
  • Yard: If you have a pet that spends time outside, it’s important to pay particular attention to the yard. Is it large enough? Does it have a secure fence? Is there easy access between the home and the yard?
  • Flooring: Pet-friendly flooring can be tough. Surfaces that can be repaired or refinished when scratched are typically the best options for homes with pets. Sealing additional layers will build up the resistance to damage from paws, claws, and general pet wear and tear.
  • Carpet: Cats are notorious for clawing and scratching at carpet, and dogs are infamous for bringing the outdoors in with them. Consider carpeting of a lesser quality in the area where your pets spend most of the time, or search for carpets that are stain resistant and easy to clean.
  • Stairs: Older pets and multileveled homes are at odds. Consider the age of your pet and how active you expect them to be so that you don’t find yourself in a position where you’re having to carry your pet between floors.


HOA?

When looking at a home, ask whether or not it is a part of a Homeowners Association and what restrictions may apply to the property. For instance, certain HOA developments limit the number and/or type of pets per household.


Most pet owners take the needs of their pets seriously. In fact, in a recent Realtor.com survey, 75 percent of the respondents said they would not accept an otherwise perfect home if it didn’t meet the needs of their pet. When it comes down to it, prioritizing your pet when buying a home not only insures your pet’s well-being, but that of your household, as well.