Market Data July 7, 2021

Local Nuances in Real Estate

“All markets are local” is a commonly used phrase in real estate.

This adage is proving to be true as we notice slight changes recently in the market.

Bottom line, the market, in some locations, is not behaving exactly like it did even 30 days ago. Properties that perhaps would have received 10 or more offers last month, are now receiving only one.

It is as important as ever to examine not only the general market area, but also hyper-local markets in order to understand the nuances that exist in specific locations.

A common activity we perform with our clients is to research the months of supply in their own neighborhood. We will frequently find that this stat varies considerably from the market as a whole.

To illustrate how ‘all markets are local,’ take a look at the days of inventory statistic for the following markets:

Larimer County = 18 days
Fort Collins = 15 days
80521 Zip Code = 24 days
80525 Zip Code = 9 days

While data on the overall market clarifies overall trends, it is the hyper-local research that is incredibly valuable when pricing property. If you have questions or would like to know what is going on in your hyper-local neighborhood market just let me know. I’m always happy to share!

Market Data July 6, 2021

More Inventory for Homebuyers!

We are noticing a trend that is very good news for buyers.

Inventory has been increasing over the last month which means that buyers now have more properties to consider.

Just in the last week, the number of homes for sale has increased:

13% in Larimer County

12% in Weld County

11% in Metro Denver

If you are a buyer who has been waiting for home properties to look at, now is the time! Just let me know if I can be of assistance.

Economic May 8, 2021

Different Era, Different Market

Recently it seems there are many attempted comparisons being made between today’s real estate market and the 2006-2007 market.

It seems that people fear a repeat of what happened to the market in 2008 and 2009.

Buyers, understandably, want to make smart decisions and don’t want to buy in advance of any downturn.

The reality is this.  There are some similarities between now and the pre-bubble market of 15 years ago.  Namely, prices are appreciating quickly.

However, there is one massive difference.

The inventory of homes for sale right now is drastically different than 15 years ago.

The rules of economics tell us that, in order for prices to crash, demand needs to diminish, supply needs to swell, or some combination of the two.

Here’s the deal.  Supply today is a fraction of what is was 15 years ago.

Homes for sale today:

  • Larimer County = 238
  • Weld County = 226
  • Metro Denver = 2,594

Homes for sale 15 years ago:

  • Larimer County = 2,998
  • Weld County = 1,113
  • Metro Denver = 29,045

The reason why prices flattened and decreased slightly along the Front Range in 2009 is because the National economy had a meltdown and there was a glut of supply.

We do not have anything similar to those same dynamics today.

We are watching the market closely every single day.  While we don’t expect the current pace of appreciation to keep up, we believe inventory levels keep us insulated from any kind of crash.

Market Data April 28, 2021

Q1 Northern Colorado Gardner Report

The following analysis of the Metro Denver & Northern Colorado real estate market is provided by Windermere Real Estate Chief Economist Matthew Gardner. We hope that this information may assist you with making better-informed real estate decisions. For further information about the housing market in your area, please don’t hesitate to contact your Windermere Real Estate agent.

REGIONAL ECONOMIC OVERVIEW

Following the decline in employment last winter, Colorado has started to add jobs back into its economy. The latest data shows that the state has now recovered more than 219,000 of the 376,000+ jobs that were lost due to COVID-19. This is certainly positive, but there is a long way to go to get back to pre-pandemic employment levels. Denver and Fort Collins continue to have the greatest improvement in employment, but all markets show job levels well below pre-pandemic levels. With total employment levels rising, the unemployment rate stands at 6.6%, down from the pandemic peak of 12.1%. Regionally, unemployment levels range from a low of 5.6% in Fort Collins and Boulder to a high of 6.7% in Greeley. COVID-19 infection rates have started to increase again, and this has the potential to negatively impact the job market. I am hopeful that the state will not be forced to pull back reopening, but this is certainly not assured.

COLORADO HOME SALES

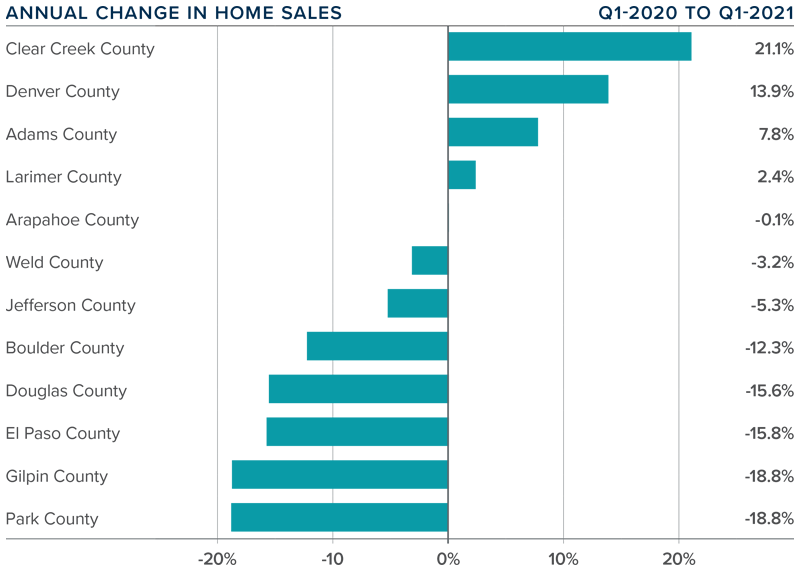
❱ 2021 started off on a bit of a sour note, with total sales down 1.2% compared to the same period in 2020. Sales were 29.2% lower than in the final quarter of 2020 as 8,645 homes sold.

❱ Sales were higher in four of the counties contained in this report, were essentially flat in one, and dropped in seven. It was pleasing to see significant sales growth in the large counties of Denver and Adams.

❱ Another positive was that pending sales, which are an indicator of future closings, were 4.8% higher than in the fourth quarter of 2020 and 5% higher than a year ago.

❱ The disappointing number of home sales overall can primarily be attributed to the woeful lack of inventory. Listings in the quarter were down more than 61% year over year and were 40.6% lower than in the fourth quarter of 2020.
 

COLORADO HOME PRICES
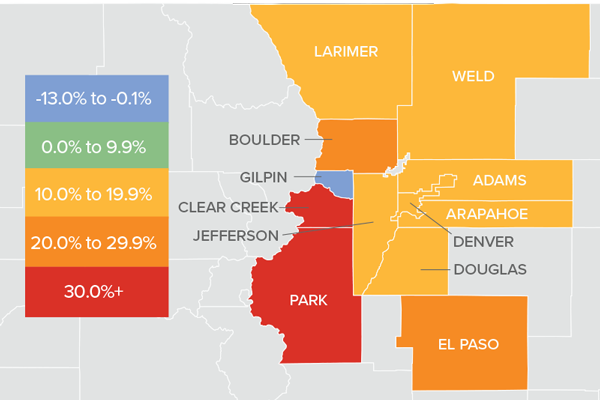
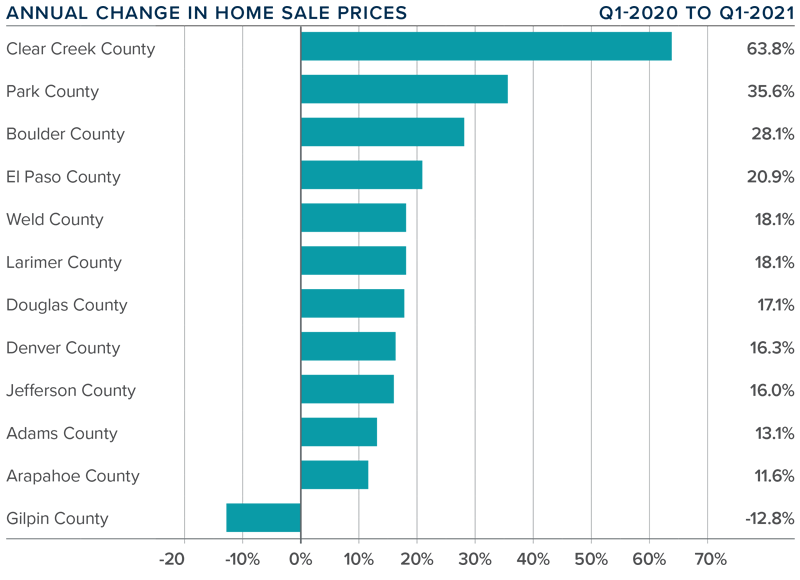
❱ Prices continue to appreciate at a very rapid pace, with the average sale price up 16.5% year over year, to an average of $556,100. Home prices were also 4.4% higher than in the fourth quarter of 2020.

❱ Buyers appear to be out in force, and this demand—in concert with very low levels of inventory—continues to heat the market.

❱ Prices rose over last year across all markets covered by this report, with the exception of the very small Gilpin County. All other counties saw sizeable gains and the trend of double-digit price growth continued unabated.

❱ Affordability levels are becoming a greater concern as prices rise at a far faster pace than wages. Even though mortgage rates have started to rise, they haven’t yet reached the level needed to take some of the heat out of the market.
 

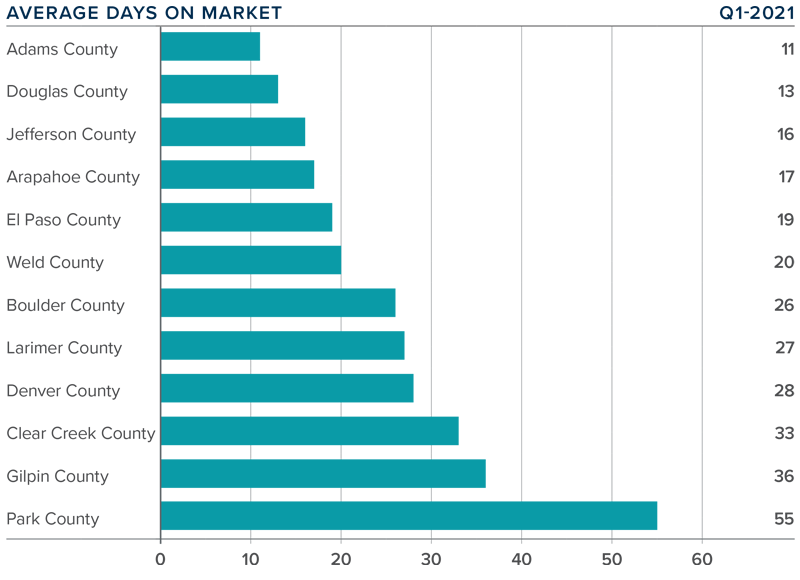
DAYS ON MARKET

❱ The average time it took to sell a home in the markets contained in this report dropped 20 days compared to the first quarter of 2020.

❱ The amount of time it took to sell a home dropped in every county contained in this report compared to the fourth quarter of 2020.

❱ It took an average of 25 days to sell a home in the region, down one day from the fourth quarter of 2020.

❱ The Colorado housing market remains very tight, as demonstrated by the fact that it took less than a month for homes to sell in all but two counties.
 

CONCLUSIONS
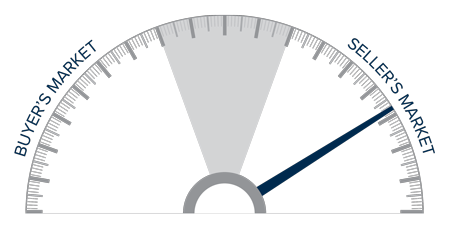
This speedometer reflects the state of the region’s real estate market using housing inventory, price gains, home sales, interest rates, and larger economic factors.

The relatively low level of home sales is not a surprise given how few choices there are for buyers. Sellers are certainly benefitting from strong demand, as demonstrated by the significant price growth. I maintain my belief that there will be an increase in inventory as we move through the year, but it is highly unlikely that we will see a balanced market in 2021.

Given these factors, I am moving the needle a little more in favor of sellers, as demand is likely to continue to exceed supply.

ABOUT MATTHEW GARDNER

As Chief Economist for Windermere Real Estate, Matthew Gardner is responsible for analyzing and interpreting economic data and its impact on the real estate market on both a local and national level. Matthew has over 30 years of professional experience both in the U.S. and U.K.

In addition to his day-to-day responsibilities, Matthew sits on the Washington State Governors Council of Economic Advisors; chairs the Board of Trustees at the Washington Center for Real Estate Research at the University of Washington; and is an Advisory Board Member at the Runstad Center for Real Estate Studies at the University of Washington where he also lectures in real estate economics.

Market Data April 28, 2021

Troutman Park 1st Qtr Real Estate Review

We’ve got a quarter of the year now to give us an idea of what Northern Colorado’s Real Estate Market has in store for 2021. Many were surprised to see how well Real Estate in our area weathered all the storms that last year threw at all of us. I think it’s fair to say that all of us are shocked to see what’s happened through the beginning of this year!

Let’s take a look back to see how Troutman Park’s Real Estate market has done through March 31, compared to the same time during other recent years. Here are the numbers:

2021 Q1 – 9 homes sold for $3,989,900. They ranged from $405,500 – $630,000 at an average of $433,322

2020 Q1 – 13 homes sold for $4,924,800. They ranged from $325,000-$420,000 at an average of $378,830

2019 Q1 – 12 homes sold for $4,439,400. They ranged from $325,000-$450,500 at an average of $369,950

2018 Q1 – 9 homes sold for $3,078,000. They ranged from $290,000-$394,000 at an average of $342,000

2017 Q1 – 7 homes sold for $2,377,200. They ranged from $257,500-$379,700 at an average of $339,600

2016 Q1 – 6 homes sold for $1,871,500. They ranged from $205,000-$400,000 at an average of $311,916

2015 Q1 – 15 homes sold for $4,004,175. They ranged from $218,325-$302,500 at an average of $266,945

We have a new All Time High in our neighborhood! The home at 819 Marble was listed for sale on at $585,000 on February 18, 2021 and quickly had 8 offers in it’s first few days on the market. It went under contract on Feb 22 and closed 22 days later on March 16th.

What I found interesting about the sale of 819 Marble at $630,000 was that it passed the previous neighborhood all time high sales price of $507,000 (731 Benthaven St) by $123,000! That’s an increase of 24.26%!

We’re seeing this in other areas throughout Fort Collins as well. The reason for such a significant jump is the inventory available for sale is down 71% here in Larimer County compared to last year at the same time. With all time low interest rates available many decided to put off their search for a new home and refinance the mortgage they were currently in to either save money or add on and improve their current residence.

That combined with the fact that home builders are seeing increases in costs and reduction in materials available (lumber, appliances, etc) means that there is a historic low in terms of what is available for buyers to choose from. At the same time there is a rise in demand because of the low interest rates and increasing desire for high quality suburban living.

The end result means there is a lot of opportunity for sellers to take advantage of this perfect storm if they want to cash in on all that equity that has developed.

If you have questions about anything or if you’re curious about what your home might be worth, just let me know. I grew up here in Fort Collins, I’ve worked in Real Estate since 2002, live right here in Troutman Park and I’m always happy to share.

Market Data April 6, 2021

Interest Rate Predicition!?!

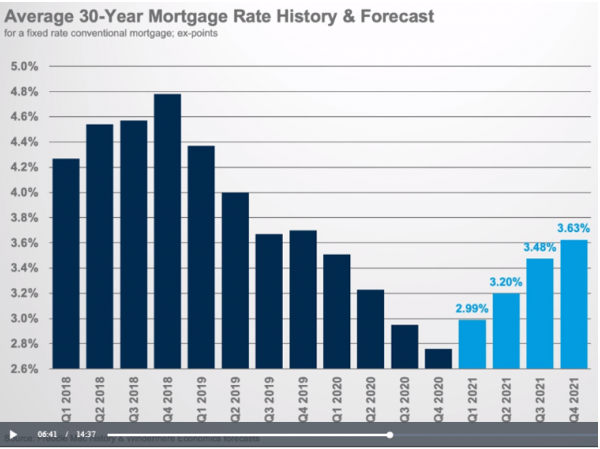
Windermere’s Chief Economist, Matthew Gardner has made his new mortgage interest rate prediction for 2021.


You can see his breakdown of interest rates and other economic factors by clicking on the image below and watching his newest video.


By the end of the year he predicts rates will rise to 3.63%.  By the end of the 3rd quarter, he sees rates at 3.48%.


This would be a 0.5% increase by year-end compared to today.


What this would mean for home buyers is a 5% higher monthly payment compared to today.

Market Data March 3, 2021

How fast are houses selling?

In the residential real estate industry, inventory is typically measured in months.

For example, the definition of a “sellers’ market” is when there is less than 4 months of inventory on the market.  Meaning, at the current pace of sales, it would take less than four months to sell all the homes currently for sale.

Today it makes more sense to measure inventory in days instead of months.

Here is the number of residential properties currently listed for sale in each market:

  • Larimer County = 255
  • Weld County = 261
  • Metro Denver = 1,645

Here is the current pace of sales in each market:

  • Larimer County = 10/day
  • Weld County = 10/day
  • Metro Denver = 112/day


So, at the current pace of sales, this is how long it would take to sell all the residential properties currently for sale in each market:

  • Larimer County = 26 days
  • Weld County = 27 days

Metro Denver = 15 days

Market Data February 18, 2021

Questions we get about market activity right now!

iStock-177709534.jpg

Do you think more properties will come on the market this Spring?  Yes, the normal pattern in our market is for new listings to be 40% to 70% higher in April versus January.  The peak month for new listings is typically June.

Do you think buyer demand will grow even more as time goes on?  Yes, for two main reasons.  Buyer activity, just like listing activity, increases significantly in the Spring and Early Summer.  Plus, we expect the economy to open up even more as the COVID vaccine gets rolled out over the course of the year. Although in previous years prior to Covid-19 we’ve noticed that buyer activity really dies down in July/August. It will be interesting to see if there is enough pent up demand to break that trend this year.

Do you think interest rates will go up?  Yes, all of the trusted forecasters and economists expect rates to be slightly higher by the end of the year.  Our own Chief Economist sees rates at 3.07% by year-end.

Do you think prices will keep rising?  Yes, because of the simple economic forces of supply and demand.  Supply is at historic lows.  The number of properties for sale today is roughly 80% below the average.  Demand is being fueled not only by the low-interest rates, but also a rebounding local job market that is poised to rebound even more.  Plus, the new work-from-home dynamic positions the Front Range as a sought after place to live.

Market DataTroutman Park February 10, 2021

Troutman Park 2020 Real Estate Year in Review

All the data from 2020 is in and it’s time to look back and see how Troutman Park’s Real Estate Market has performed compared to other recent years.

Back in March last year many felt like property values would decline like many other investments did through all the Covid-19 adjustments. If you own a home in the Troutman Park area you’ll probably be happy to see that we’ve actually fared quite well though.


Here are the numbers compared to other recent years:

2020 – 70 homes sold for $28,164,381. They ranged from $331,000-$507,000 at an average of $402,348

2019 – 72 homes sold for $27,749,783. They ranged from $300,000-$505,000 at an average of $385,413

2018 – 51 homes sold for $18,681,050. They ranged from $286,500-$480,000 at an average of $366,295

2017 – 56 homes sold for $19,372,269. They ranged from $257,500-$443,000 at an average of $345,933

2016 – 55 homes sold for $17,891,500. They ranged from $205,000-$436,000 at an average of $325,300

Since 2016 the average price of Troutman Park’s Real Estate has increased by almost 24%

Right now Northern Colorado is seeing serious demand for housing while supply is at an all time low which is resulting in competing offers for many properties and accelerating our appreciation rate.

To give you an idea of where we’re at Fort Collins has 91 homes on the market between $350,000-$500,000 and 78 of those are under contract leaving only 13 available for buyers to choose from (as of 2/10/2021).

Right now in all of Fort Collins there is a total of 457 residential properties that are on the market and 330 of those (72%) are under contract. The average price of those homes that are under contract is $519,884.

With interest rates around 3% buyers are able to justify paying premiums for homes that are move in ready. That combined with all of people who have become frustrated with big city living conditions/restrictions over the last year who are looking to relocate to areas like Northern Colorado means there is tremendous opportunity for anyone in our area that is thinking about selling a home this year!

If you have questions about Real Estate I’m always happy to share what I know. I grew up here in Fort Collins, I’ve worked in Real Estate since 2002 and live right here in Troutman Park so feel free to reach out if there is any way I can be of assistance.

EconomicMarket Data February 5, 2021

Latest Appreciation Ratings

CoreLogic produces one of the most respected and widely-used home price index reports in the United States.

They track home price appreciation in the largest markets across the Country.

Here are the highlights from their most recent report:

  • Home prices are up 9.2% Nationally
  • This is the highest increase since February, 2014
  • Denver ranks fourth among the largest 10 cities
  • Denver’s appreciation was 8.8% over the last year
  • Phoenix was first at 13.7%