Economic March 5, 2021

Homebuilder Headaches

The National Association of Home Builders recently surveyed their members to ask them about the challenges they currently face and the challenges they expect to face.

Far and away, the biggest headache for homebuilders right now is the rising cost of building materials.

96% of the survey respondents cited this as a significant problem they faced in 2020 and 89% believe it will be a significant problem this year.

It turns out that builders are not only concerned about building material costs, but also the availability of those materials.

78% said availability was a significant problem last year and 80% said that it will be a significant problem in 2021.

Due to increasing materials costs, we notice builders locally having to raise their base prices significantly in order to keep up with rising costs.

Market Data March 3, 2021

How fast are houses selling?

In the residential real estate industry, inventory is typically measured in months.

For example, the definition of a “sellers’ market” is when there is less than 4 months of inventory on the market.  Meaning, at the current pace of sales, it would take less than four months to sell all the homes currently for sale.

Today it makes more sense to measure inventory in days instead of months.

Here is the number of residential properties currently listed for sale in each market:

  • Larimer County = 255
  • Weld County = 261
  • Metro Denver = 1,645

Here is the current pace of sales in each market:

  • Larimer County = 10/day
  • Weld County = 10/day
  • Metro Denver = 112/day


So, at the current pace of sales, this is how long it would take to sell all the residential properties currently for sale in each market:

  • Larimer County = 26 days
  • Weld County = 27 days

Metro Denver = 15 days

Economic February 24, 2021

How Lumber is affecting our Housing Market

The price of lumber has doubled in three months.

Lumber is just one of several examples of skyrocketing materials costs which are impacting both home builders and home buyers.

The cost of lumber is now at a record-level $1000 per 1000 board feet.

These rising costs not only add to the sales price of a home but also add to the inventory shortage issue.  Some large, publicly-traded home building companies are slowing production in hopes of building costs dropping over the next few months.

Many people expected lumber prices to drop, or at least level off, when the tariff on Canadian lumber changed in December.

However, because demand has been so high from both building and remodeling, lumber costs continue to climb.

Market Data February 18, 2021

Questions we get about market activity right now!

iStock-177709534.jpg

Do you think more properties will come on the market this Spring?  Yes, the normal pattern in our market is for new listings to be 40% to 70% higher in April versus January.  The peak month for new listings is typically June.

Do you think buyer demand will grow even more as time goes on?  Yes, for two main reasons.  Buyer activity, just like listing activity, increases significantly in the Spring and Early Summer.  Plus, we expect the economy to open up even more as the COVID vaccine gets rolled out over the course of the year. Although in previous years prior to Covid-19 we’ve noticed that buyer activity really dies down in July/August. It will be interesting to see if there is enough pent up demand to break that trend this year.

Do you think interest rates will go up?  Yes, all of the trusted forecasters and economists expect rates to be slightly higher by the end of the year.  Our own Chief Economist sees rates at 3.07% by year-end.

Do you think prices will keep rising?  Yes, because of the simple economic forces of supply and demand.  Supply is at historic lows.  The number of properties for sale today is roughly 80% below the average.  Demand is being fueled not only by the low-interest rates, but also a rebounding local job market that is poised to rebound even more.  Plus, the new work-from-home dynamic positions the Front Range as a sought after place to live.

Market DataTroutman Park February 10, 2021

Troutman Park 2020 Real Estate Year in Review

All the data from 2020 is in and it’s time to look back and see how Troutman Park’s Real Estate Market has performed compared to other recent years.

Back in March last year many felt like property values would decline like many other investments did through all the Covid-19 adjustments. If you own a home in the Troutman Park area you’ll probably be happy to see that we’ve actually fared quite well though.


Here are the numbers compared to other recent years:

2020 – 70 homes sold for $28,164,381. They ranged from $331,000-$507,000 at an average of $402,348

2019 – 72 homes sold for $27,749,783. They ranged from $300,000-$505,000 at an average of $385,413

2018 – 51 homes sold for $18,681,050. They ranged from $286,500-$480,000 at an average of $366,295

2017 – 56 homes sold for $19,372,269. They ranged from $257,500-$443,000 at an average of $345,933

2016 – 55 homes sold for $17,891,500. They ranged from $205,000-$436,000 at an average of $325,300

Since 2016 the average price of Troutman Park’s Real Estate has increased by almost 24%

Right now Northern Colorado is seeing serious demand for housing while supply is at an all time low which is resulting in competing offers for many properties and accelerating our appreciation rate.

To give you an idea of where we’re at Fort Collins has 91 homes on the market between $350,000-$500,000 and 78 of those are under contract leaving only 13 available for buyers to choose from (as of 2/10/2021).

Right now in all of Fort Collins there is a total of 457 residential properties that are on the market and 330 of those (72%) are under contract. The average price of those homes that are under contract is $519,884.

With interest rates around 3% buyers are able to justify paying premiums for homes that are move in ready. That combined with all of people who have become frustrated with big city living conditions/restrictions over the last year who are looking to relocate to areas like Northern Colorado means there is tremendous opportunity for anyone in our area that is thinking about selling a home this year!

If you have questions about Real Estate I’m always happy to share what I know. I grew up here in Fort Collins, I’ve worked in Real Estate since 2002 and live right here in Troutman Park so feel free to reach out if there is any way I can be of assistance.

EconomicMarket Data February 5, 2021

Latest Appreciation Ratings

Market Data February 3, 2021

Employment recovery fuels NoCo Real Estate Market

Interest Rates

“How could the real estate market be so strong in the middle of a pandemic?”

That is a fair question and one we hear frequently from our clients.

There are several reasons for this but two stand out.

  • Interest rates
  • Jobs

Employment has bounced back much quicker than most people expected.  When COVID first showed up, the expectation was that many industries would be hit hard for a prolonged period of time.

The reality is that only a few industries were severely impacted by COVID and the rest were able to get back to a near-normal level of business relatively fast.

Additionally, what we find along the Front Range is that our ‘job bounce’ is even better than the national average.


Here are the numbers…

The COVID-peak unemployment rate for the Front Range looked like this:

  • Larimer County = 11.1%
  • Weld County = 10.1%
  • Metro Denver = 12.3%

Today it looks like this:

  • Larimer County = 5.2%
  • Weld County = 5.2%
  • Metro Denver = 6.4%


Nationally, unemployment peaked at 14.8% and now stands at 6.7%.

So, a main reason why values are soaring right now is because jobs have bounced back, and that bounce combined with near all time low interest rates has increased demand while supply remains at a record low!

Market Data January 31, 2021

Q4 2020 Colorado Real Estate Market Update

The following analysis of the Metro Denver & Northern Colorado real estate market is provided by Windermere Real Estate Chief Economist Matthew Gardner. We hope that this information may assist you with making better-informed real estate decisions. For further information about the housing market in your area, please don’t hesitate to contact your Windermere agent.


REGIONAL ECONOMIC OVERVIEW

The job recovery that appeared to be firmly in place in the summer has started to wane. Though Colorado has recovered more than 209,000 of the jobs lost due to COVID-19, employment levels remain almost 210,000 below the level seen last February. Even with employment growth stalling, the unemployment rate stands at a relatively respectable 6.4%, down from a peak of 12.2%. Regionally, unemployment levels range from a low of 5.4% in Boulder to a high of 6.9% in Greeley. Rising COVID-19 infection rates continue to impact the job recovery, and I do not see much in the way of palpable improvement until a vaccine becomes freely available, likely in the second half of this year.

COLORADO HOME SALES

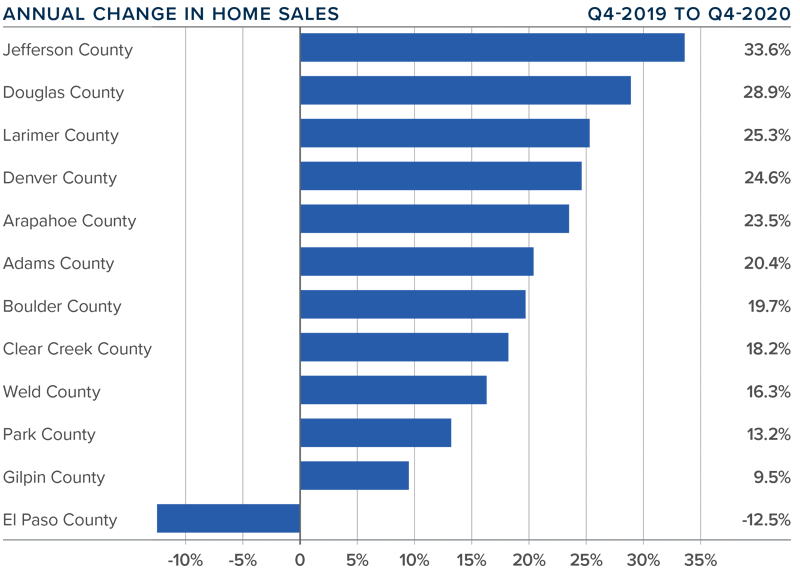
❱ In the final quarter of 2020, 12,207 homes sold. This represents an increase of 21.8% compared to the fourth quarter of 2019, but 19% lower than in the third quarter. I am not concerned, though, because seasonal influences tend to impact sales in the winter.

❱ Sales rose in all markets other than El Paso compared to the fourth quarter of 2019. I believe sales are only limited by the number of homes on the market.

❱ Inventory levels remain well below what I would like to see. The average number of homes on the market in the fourth quarter was down 55% from the same period in 2019.

❱ Pending sales were 34% lower compared to the third quarter. Again, seasonality and a lack of homes to buy impact this figure. Pending sales are still 13% higher than a year ago.
COLORADO HOME PRICES
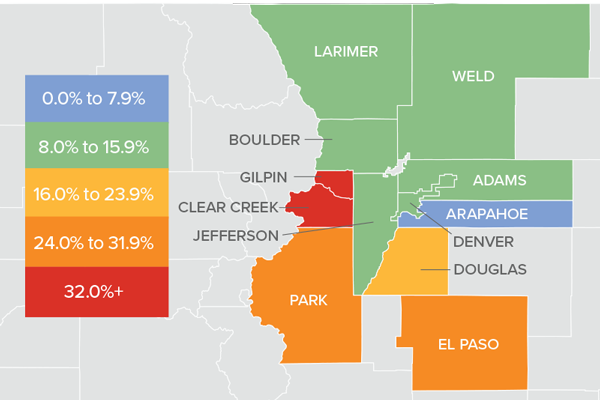
❱ Home prices rose significantly in the fourth quarter, with the average price increasing 13.7% year-over-year to $532,492. Prices were up 1.8% compared to the third quarter of this year.

❱ Interest rates are unlikely to drop much further and this will lead price growth to slow as we move through 2021.

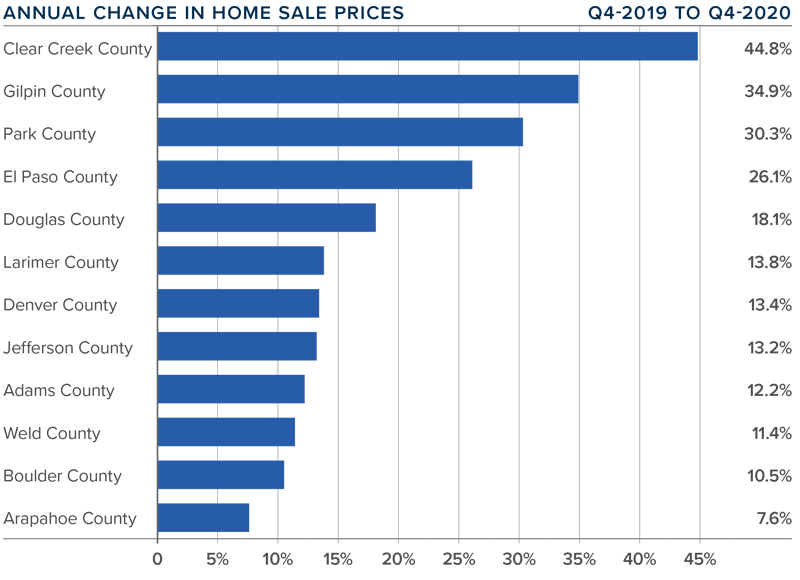
❱ Year-over-year, prices rose across all markets covered by this report, with significant appreciation in Clear Creek, Gilpin, Park, and El Paso counties. Every county but Arapahoe saw double-digit price gains.

❱ Affordability in many Colorado markets remains a concern as prices continue to rise at well-above-average rates. That said, I anticipate we will see price growth moderate in 2021.
DAYS ON MARKET

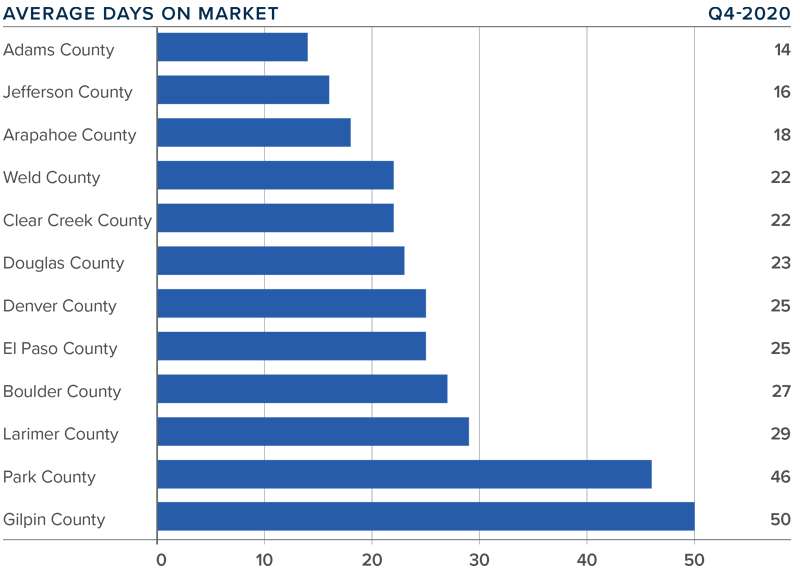
❱ The average number of days it took to sell a home in the markets contained in this report dropped 15 days compared to the final quarter of 2019.

❱ The amount of time it took to sell a home dropped in every county contained in this report compared to the fourth quarter of 2019.

❱ It took an average of 26 days to sell a home in the region, down 3 days compared to the third quarter of 2020.

❱ The Colorado housing market continues to demonstrate solid demand, and buyers are clearly competitive as suggested by the short length of time it is taking to sell a home.
CONCLUSIONS

This speedometer reflects the state of the region’s real estate market using housing inventory, price gains, home sales, interest rates, and larger economic factors.

Home sales and prices are significantly higher than a year ago, and demand for housing is very much in place. Naturally, this favors home sellers who are still in control of the market. I do expect to see some improvement in listing activity this year, which, in concert with modestly rising interest rates, will likely start to take some of the steam out of the market. However, any moderation in the market has yet to appear. Even given the possible headwinds mentioned above, I am moving the needle a little more in favor of sellers, as demand is likely to exceed supply for the time being.


ABOUT MATTHEW GARDNER

As Chief Economist for Windermere Real Estate, Matthew Gardner is responsible for analyzing and interpreting economic data and its impact on the real estate market on both a local and national level. Matthew has over 30 years of professional experience both in the U.S. and U.K.

In addition to his day-to-day responsibilities, Matthew sits on the Washington State Governors Council of Economic Advisors; chairs the Board of Trustees at the Washington Center for Real Estate Research at the University of Washington; and is an Advisory Board Member at the Runstad Center for Real Estate Studies at the University of Washington where he also lectures in real estate economics.

Market DataMortgage January 19, 2021

Economists Prediction on Interest Rates

Interest Rates

Where are interest rates headed?

This question was one of many which were addressed during our annual Market Forecast yesterday.

Our Chief Economist, Matthew Gardner, provided insight on rates, prices, inventory and many other fascinating topics.

Matthew’s prediction is for rates to creep up to 3.07% by the end of 2021.  They are currently at 2.79%.

The image below shows how his prediction compares with predictions of his economist colleagues.

Please let me know if you have questions or if you would like a recording of the full presentation.

EconomicMarket Data January 15, 2021

Economists Prediction on Interest Rates

Interest Rates

Where are interest rates headed?

This question was one of many which were addressed during our annual Market Forecast yesterday.

Our Chief Economist, Matthew Gardner, provided insight on rates, prices, inventory and many other fascinating topics.

Matthew’s prediction is for rates to creep up to 3.07% by the end of 2021.  They are currently at 2.79%.

The image below shows how his prediction compares with predictions of his economist colleagues.

Please let me know if you have questions or if you would like a recording of the full presentation.