Economic February 24, 2021

How Lumber is affecting our Housing Market

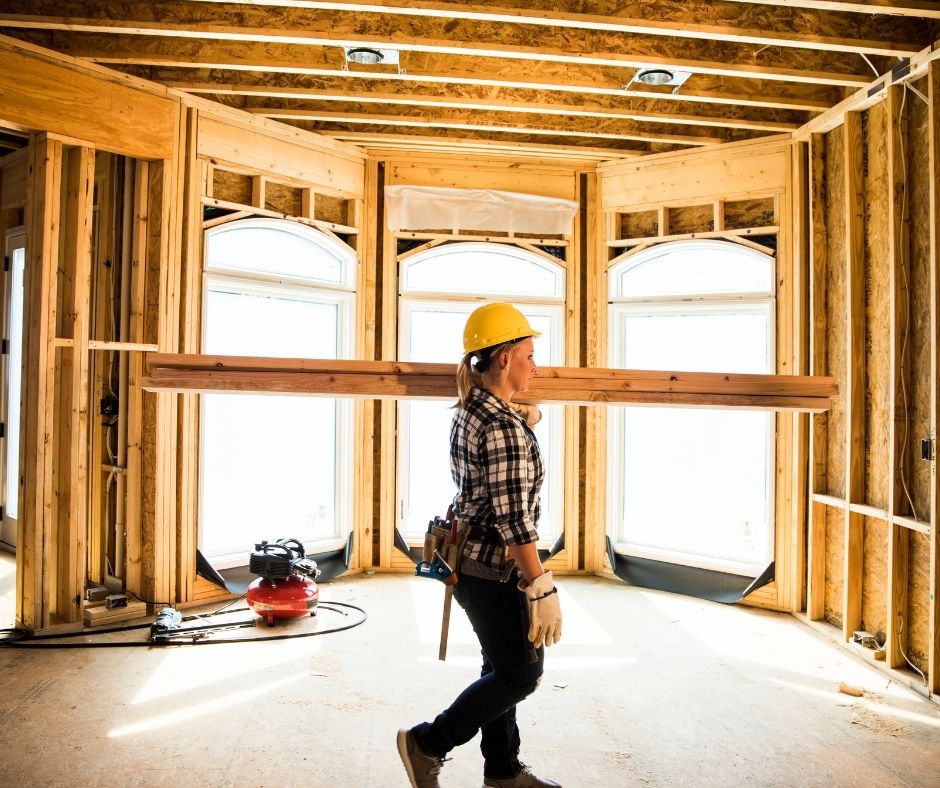
The price of lumber has doubled in three months.

Lumber is just one of several examples of skyrocketing materials costs which are impacting both home builders and home buyers.

The cost of lumber is now at a record-level $1000 per 1000 board feet.

These rising costs not only add to the sales price of a home but also add to the inventory shortage issue.  Some large, publicly-traded home building companies are slowing production in hopes of building costs dropping over the next few months.

Many people expected lumber prices to drop, or at least level off, when the tariff on Canadian lumber changed in December.

However, because demand has been so high from both building and remodeling, lumber costs continue to climb.

Market Data December 7, 2020

Real Estate Market Perspective

House

Here’s a little perspective on the inventory of homes for sale in today’s market…

First we’ll look at Metro Denver:

  • The average number of residential listings for sale at this time of year is 15,577
  • The highest-ever for this time of year is 29,722 which occurred in 2006
  • The number of listings right now is 4,821
  • So, inventory in Metro Denver is roughly one-third of the average and 25,000 fewer than the highest-ever.
  • DMAR is the source of the stats listed above


Now, Northern Colorado:

  • Larimer County has 802 active listings today
  • Based on 10 years of data, this is the lowest it has ever been
  • The high in Larimer County occurred in 2010 with 2608 listings so today’s inventory is one-third of what it was 10 years ago.
  • Inventory today in Weld County is 727 which isn’t the lowest-ever.
  • The lowest during the last 10 years was 2017.

The highest was 2010 with 1791 properties so today there are roughly 1,000 fewer properties to choose from.

Market Data July 10, 2020

More Homes Needed to Balance Market

iStock-177709534.jpg

Compared to exactly one year ago, the supply of homes is down:

  • 32.6% in Metro Denver
  • 25.1% in Northern Colorado

An interesting and useful measurement we track is months of inventory.  This stat tells how long it would take to sell all of the homes currently for sale at the current pace of sales.

Of course, months of supply can vary greatly by price range and location.  However, this stat does a good job of explaining the overall state of the market.

Specifically, months of supply tells us if the market is in balance.

A ‘balanced’ market is when there is 4 to 6 months of supply.  A buyers market occurs when the stat is higher than this range.  A sellers market occurs when it is lower.

The months of supply looks like this in our market:

  • 1.0 months in Metro Denver
  • 1.3 months in Northern Colorado

What this means is our markets are significantly under-supplied and more homes are needed to meet demand. With that being the case you can expect that overall property values will continue to rise for the foreseeable future.

BuyersSellers February 17, 2020

NoCo Real Estate Stats

Here are some Northern Colorado Real Estate stats I think you’ll like:

  • Prices are up 3.5% compared to last year
  • Inventory is up 10% which means there is more selection for buyers
  • We just had the most active January in terms of closings in over 10 years
  • Well over 13,000 residential properties representing $5.4 Billion of volume has sold in the last 12 months

If you would like to see a video recap of our annual Market Forecast you can watch that HERE.

BuyersMarket Data December 18, 2019

Good News for home buyers in NOCO!

Here are some vital signs for the Northern Colorado Real Estate Market. This data will show how statistics now compare to this time last year. 

First, Larimer County:

  • Average prices are up 2.4%
  • Number of transactions is down 2.5%
  • Inventory is up 11.9%
  • Days on market is up 4.1%

Now, Weld County:

  • Average prices are up 4.3%
  • Number of transactions is up 3.6%
  • Inventory is up 12.9%
  • Days on market is flat (same as last year)

What this means is prices are still going up, just not as fast as they were a couple of years ago.  More inventory is coming on the market which is great news for buyers.


Market Data October 28, 2019

Most Active Price Ranges


What is the most active price range in Northern Colorado?  Take a guess…

  • $300,000 to $400,000
  • $400,000 to $500,000
  • $500,000 to $750,000
  • $750,000 and above

By far, the most active price range is $300,000 to $400,000 with 60% more closed transactions than the $400,000 to $500,000 range and 400% more than homes priced $750,000 and above.

However, this lower price range does not have the most inventory.  The price range with the greatest selection of homes is $500,000 to $750,000.