
 Facebook
 Twitter
 Pinterest
 Copy Link
Troutman Park Quarterly Real Estate Update
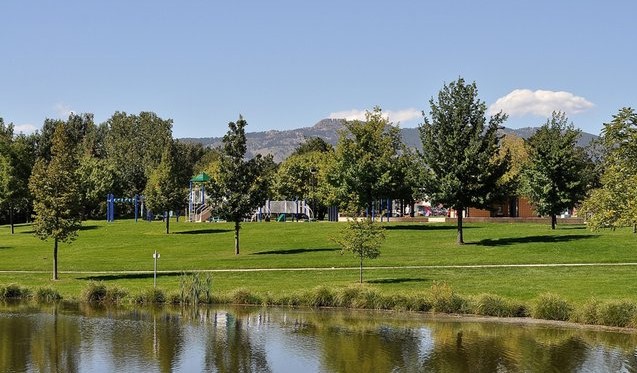
We’re officially 1/4 of the way through 2022 believe it or not. Every quarter I like to take a look at what’s happened with our neighborhood’s real estate sales.
So let’s take a look back to see how the Troutman Park Real Estate market has done through March 31 this year compared to the same time during other recent years. Here are the numbers:
2022 Q1 – 10 homes sold for $4,892,400. They ranged from $431,000 – $540,000 at an average of $489,240
2021 Q1 – 9 homes sold for $3,989,900. They ranged from $405,500 – $630,000 at an average of $433,322
2020 Q1 – 13 homes sold for $4,924,800. They ranged from $325,000-$420,000 at an average of $378,830
2019 Q1 – 12 homes sold for $4,439,400. They ranged from $325,000-$450,500 at an average of $369,950
2018 Q1 – 9 homes sold for $3,078,000. They ranged from $290,000-$394,000 at an average of $342,000
2017 Q1 – 7 homes sold for $2,377,200. They ranged from $257,500-$379,700 at an average of $339,600
2016 Q1 – 6 homes sold for $1,871,500. They ranged from $205,000-$400,000 at an average of $311,916
2015 Q1 – 15 homes sold for $4,004,175. They ranged from $218,325-$302,500 at an average of $266,945
What’s interesting about the start of 2022 is that the majority of homes that have sold in Troutman Park are on the small end of square footage for the neighborhood (right about 2,000 square feet or less with the exception of just one).
You can expect that the larger, updated homes in Troutman Park (around 2,400 square feet and bigger) will be selling in the mid $600,000’s to mid $700,000’s which is what comparable surrounding neighborhoods like Mountain Ridge Farm and The Gates at Woodridge have seen this year.
The reason for the continuation of rapid appreciation simply comes down to the current supply and demand. We have seen a few buyers start to head to the sidelines with rising interest rates that combined with escalating home values have priced some out of the market and created uncertainty with others. There do seem to be more stories of homes with only one offer in the 1st week which does bode well for active buyers.
The fact of the matter is that even with some buyers taking a break there still are not enough homes out there to supply the market’s appetite. To give you an idea the number of Sold Properties in Larimer County for the month of March 2022 was down -37% compared to last year at that time.
The end result means there is a lot of opportunity for sellers to take advantage of market conditions if they want to cash in on all the equity they have developed.
If you have questions about anything or if you’re curious about what your home might be worth, just let me know. I grew up right here in Fort Collins, I’ve worked in Real Estate since 2002, live right here in Troutman Park and I’m always happy to share.

Troutman Park 1st Qtr Real Estate Review

We’ve got a quarter of the year now to give us an idea of what Northern Colorado’s Real Estate Market has in store for 2021. Many were surprised to see how well Real Estate in our area weathered all the storms that last year threw at all of us. I think it’s fair to say that all of us are shocked to see what’s happened through the beginning of this year!
Let’s take a look back to see how Troutman Park’s Real Estate market has done through March 31, compared to the same time during other recent years. Here are the numbers:
2021 Q1 – 9 homes sold for $3,989,900. They ranged from $405,500 – $630,000 at an average of $433,322
2020 Q1 – 13 homes sold for $4,924,800. They ranged from $325,000-$420,000 at an average of $378,830
2019 Q1 – 12 homes sold for $4,439,400. They ranged from $325,000-$450,500 at an average of $369,950
2018 Q1 – 9 homes sold for $3,078,000. They ranged from $290,000-$394,000 at an average of $342,000
2017 Q1 – 7 homes sold for $2,377,200. They ranged from $257,500-$379,700 at an average of $339,600
2016 Q1 – 6 homes sold for $1,871,500. They ranged from $205,000-$400,000 at an average of $311,916
2015 Q1 – 15 homes sold for $4,004,175. They ranged from $218,325-$302,500 at an average of $266,945
We have a new All Time High in our neighborhood! The home at 819 Marble was listed for sale on at $585,000 on February 18, 2021 and quickly had 8 offers in it’s first few days on the market. It went under contract on Feb 22 and closed 22 days later on March 16th.
What I found interesting about the sale of 819 Marble at $630,000 was that it passed the previous neighborhood all time high sales price of $507,000 (731 Benthaven St) by $123,000! That’s an increase of 24.26%!
We’re seeing this in other areas throughout Fort Collins as well. The reason for such a significant jump is the inventory available for sale is down 71% here in Larimer County compared to last year at the same time. With all time low interest rates available many decided to put off their search for a new home and refinance the mortgage they were currently in to either save money or add on and improve their current residence.
That combined with the fact that home builders are seeing increases in costs and reduction in materials available (lumber, appliances, etc) means that there is a historic low in terms of what is available for buyers to choose from. At the same time there is a rise in demand because of the low interest rates and increasing desire for high quality suburban living.
The end result means there is a lot of opportunity for sellers to take advantage of this perfect storm if they want to cash in on all that equity that has developed.
If you have questions about anything or if you’re curious about what your home might be worth, just let me know. I grew up here in Fort Collins, I’ve worked in Real Estate since 2002, live right here in Troutman Park and I’m always happy to share.

Troutman Park 2020 Real Estate Year in Review
All the data from 2020 is in and it’s time to look back and see how Troutman Park’s Real Estate Market has performed compared to other recent years.
Back in March last year many felt like property values would decline like many other investments did through all the Covid-19 adjustments. If you own a home in the Troutman Park area you’ll probably be happy to see that we’ve actually fared quite well though.
Here are the numbers compared to other recent years:
2020 – 70 homes sold for $28,164,381. They ranged from $331,000-$507,000 at an average of $402,348
2019 – 72 homes sold for $27,749,783. They ranged from $300,000-$505,000 at an average of $385,413
2018 – 51 homes sold for $18,681,050. They ranged from $286,500-$480,000 at an average of $366,295
2017 – 56 homes sold for $19,372,269. They ranged from $257,500-$443,000 at an average of $345,933
2016 – 55 homes sold for $17,891,500. They ranged from $205,000-$436,000 at an average of $325,300
Since 2016 the average price of Troutman Park’s Real Estate has increased by almost 24%
Right now Northern Colorado is seeing serious demand for housing while supply is at an all time low which is resulting in competing offers for many properties and accelerating our appreciation rate.
To give you an idea of where we’re at Fort Collins has 91 homes on the market between $350,000-$500,000 and 78 of those are under contract leaving only 13 available for buyers to choose from (as of 2/10/2021).
Right now in all of Fort Collins there is a total of 457 residential properties that are on the market and 330 of those (72%) are under contract. The average price of those homes that are under contract is $519,884.
With interest rates around 3% buyers are able to justify paying premiums for homes that are move in ready. That combined with all of people who have become frustrated with big city living conditions/restrictions over the last year who are looking to relocate to areas like Northern Colorado means there is tremendous opportunity for anyone in our area that is thinking about selling a home this year!

If you have questions about Real Estate I’m always happy to share what I know. I grew up here in Fort Collins, I’ve worked in Real Estate since 2002 and live right here in Troutman Park so feel free to reach out if there is any way I can be of assistance.
Employment recovery fuels NoCo Real Estate Market
“How could the real estate market be so strong in the middle of a pandemic?”
That is a fair question and one we hear frequently from our clients.
There are several reasons for this but two stand out.
- Interest rates
- Jobs
Employment has bounced back much quicker than most people expected. When COVID first showed up, the expectation was that many industries would be hit hard for a prolonged period of time.
The reality is that only a few industries were severely impacted by COVID and the rest were able to get back to a near-normal level of business relatively fast.
Additionally, what we find along the Front Range is that our ‘job bounce’ is even better than the national average.
Here are the numbers…
The COVID-peak unemployment rate for the Front Range looked like this:
- Larimer County = 11.1%
- Weld County = 10.1%
- Metro Denver = 12.3%
Today it looks like this:
- Larimer County = 5.2%
- Weld County = 5.2%
- Metro Denver = 6.4%
Nationally, unemployment peaked at 14.8% and now stands at 6.7%.
So, a main reason why values are soaring right now is because jobs have bounced back, and that bounce combined with near all time low interest rates has increased demand while supply remains at a record low!
Troutman Park Mid-Year Real Estate Review


Now that we’ve made it through a very unique 1st half of 2020 it’s a good time to look back and see how Troutman Park’s Real Estate market has done compared to other recent years. Many felt like property values would decline like so many other investments did through all the Covid-19 adjustments. If you own a home in the Troutman Park area you’ll probably be happy to see that we’ve actually fared quite well though. Here are the numbers:
2020 Q1-Q2 29 homes sold for $11,357,425. They ranged from $325,000-$507,000 at an average of $391,635
2019 Q1-Q2 33 homes sold for $12,724,583. They ranged from $320,000-$477,000 at an average of $385,593
2018 Q1-Q2 24 homes sold for $8,813,900. They ranged from $290,000-$465,000 at an average of $367,245
2017 Q1-Q2 25 homes sold for $8,594,519. They ranged from $257,000-$443,000 at an average of $343,780
2016 Q1-Q2 27 homes sold for $8,645,100. They ranged from $205,000-$436,000 at an average of $320,188
A noteworthy sale from April this year was 731 Benthaven St which set the all time record high for our neighborhood at $507,000! So as you can see the 1st half of 2020 was actually quite impressive for property values here in Troutman Park, especially in light of everything we’ve all gone through recently.
If you have questions about Real Estate I’m always happy to share what I know. I grew up here in Fort Collins, I’ve worked in Real Estate since 2002 and live right here in Troutman Park so feel free to reach out if you ever have questions.
Troutman Park Home Sale in 2019 vs 2016
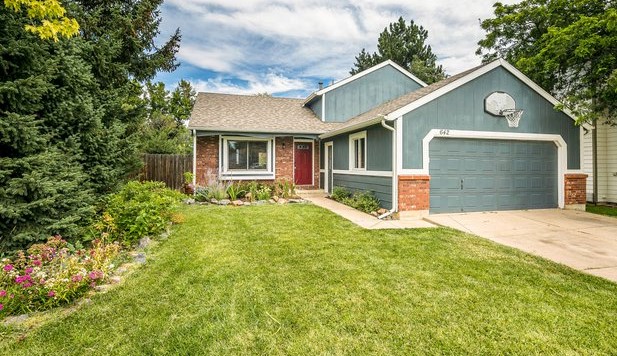

The home at 642 Larkbunting Dr. is a great barometer of Fort Collins local real estate market. The sale of this home from last month (Oct 2019) gives us a great example of today’s real estate market compared to our market back in 2016 (It’s previous sale date was 6/16/2016).
On 6/16/2016 the property at 642 Larkbunting Dr.
Sold for $330,000 (List Price of 299,000)
With 13 different offers competing for the home.
The buyers purchased the property in “As-Is” condition and guaranteed the appraised value by agreeing to bring extra $ to closing if necessary to satisfy any discrepancy between sold price and appraised value. These were typical strategies buyers would use to beat out other competing offers at that time.
In September of 2019 the same home hit the market and sold on 10/16/2019:
With updates made by the current owners (New Wood Flooring, Carpet, Kitchen Counters and Interior Painting) as well as an agreement to replace the furnace based upon buyer’s inspections.
Only one offer on the home this time but it did go under contract in just 4 days!
Sold for $375,000 (List Price of $375,000)
What all this shows us is that we’re still in a market that favors sellers but the supply and demand is starting to shift towards a little more balance. With less competition now buyers are often able to secure a property without having to waive inspection and appraisal provisions.
There can be great opportunities for both buyers and sellers when a market starts to shift. If you would like to know more about how to position yourself to take advantage of that feel free to reach out. I’m always happy to share.

Listed by 8z Real Estate
