
 Facebook
 Twitter
 Pinterest
 Copy Link

Those of us in the real estate industry agree that the years 2020 to 2022 were anomalies. During that time there were unique factors which drove abnormally high real estate activity. The number of transactions that occurred in those three years were at levels never seen before.It has become customary to compare the market in 2023 to the years 2016 to 2019 when looking at the number of closed transactions.Here’s what is interesting, while the number of closings so far this year is much less than last year, it is very close to what we saw in the more normal market of 2016 to 2019.Last month, 295 properties closed in Larimer County and 296 closed in Weld.The average January during 2016 to 2019 was 334 in Larimer and 303 in Weld.So, this year is only 12% lower than the average in Larimer County and 2% lower in Weld.
How many days on the market?

A stat that we have expected to change is finally changing.
“Days on Market” measures how long it takes for new listings to sell.
Over the last two years this stat plummeted to levels we have never seen before.
In the height of the market frenzy a year ago, properties were taking 7 days or less to sell on average.
Now, with the market cooling, Days on Market is back into double-digits.
Northern Colorado is at 20 days, a 54% increase over last year.
Metro Denver is at 12 days which is a 50% increase.
Home Inventory Increasing?

In Front Range markets, the number of homes for sale has just hit bottom or is about to hit bottom.
This is terrific news for home buyers who have been waiting for more homes to choose from.
The market is shifting, there is no doubt about that.
Prices are still increasing and we expect them to increase, just not at the pace they have been.
The inventory of homes for sale, which has been significantly down for two years, is finally starting to show signs of change.
We have been accustomed to inventory levels being down 30% to 50% compared to the prior year.
That is not the case anymore.
Inventory in Larimer and Weld County is now only down roughly 5% year over year.
Inventory in Metro Denver is now up 13.5% compared to this time in 2021.
We believe this is a legitimate shift in the market, not just a short-term anomaly.
No need to worry about prices crashing or a housing bubble. There is still too little supply and too much demand for that to happen.
However, the pace of price of appreciation will certainly get back to more normal levels of 5% to 6% per year instead of 20% to 25% per year.
Bottom line, this market shift has been a long time coming and is very good news for buyers.
Townhome Construction
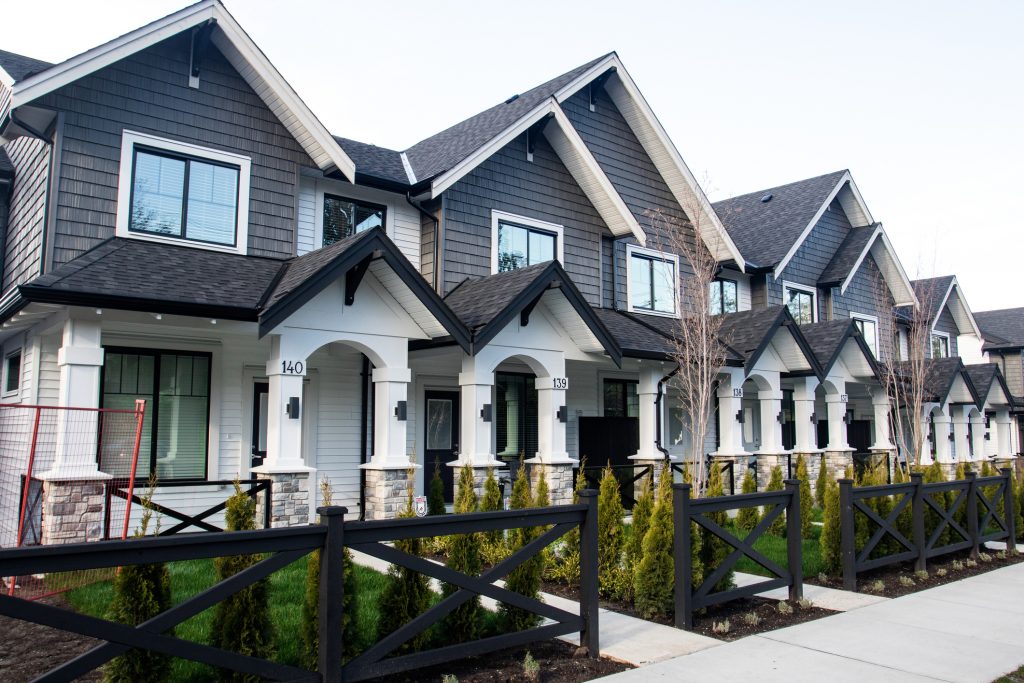
Townhome construction has surged in the last 12 months. This is welcome news for first-time buyers who benefit from the lower prices that multi-family product tends to provide.
According to the National Association of Home Builders, townhome construction has jumped up 28% compared to the previous year.
Townhomes now represent 13% of all new residential construction starts.
Is Housing Inventory Increasing?

A review of the September market stats shows a slight increase in inventory along the Front Range.
The way we currently measure inventory is in days.
Meaning, at the current pace of sales, how many days would it take to sell all of the inventory currently for sale.
The results, based on September’s activity, shows only a slight increase compared to August. This increase can be tied to seasonality as we always experience a slight cooling off of the market heading into the Fall.
Here is what the residential inventory looks like in each of our markets:
- Larimer County = 25 days
- Weld County = 23 days
- Metro Denver = 21 days
Bottom line, the residential market is still very healthy.
Staggering Stat

By definition, a real estate market is balanced when there is 4 to 6 months of inventory currently for sale.
Anything less than 4 to 6 months means a Sellers’ market, anything more means a Buyers’ market.
For example, if there are 1,000 closings per month in a market, the market would be balanced if 4,000 to 6,000 homes were available for sale.
Here is a staggering stat for you…
At the current pace of sales, the Front Range market would need 6 to 7 times more inventory for the market to be balanced.
This is why we don’t see any sort of significant market correction or anything resembling ‘the market crashing.’ Bottom line, the market is still undersupplied.
Here are the numbers:
• Larimer County has 441 properties for sale and would need 2,200 to be balanced.
• Weld County has 322 properties for sale and would need 2,000 to be balanced.
• Metro Denver has 3,023 properties for sale and would need 20,000 to be balanced.
More Inventory for Homebuyers!

We are noticing a trend that is very good news for buyers.
Inventory has been increasing over the last month which means that buyers now have more properties to consider.
Just in the last week, the number of homes for sale has increased:
13% in Larimer County
12% in Weld County
11% in Metro Denver
If you are a buyer who has been waiting for home properties to look at, now is the time! Just let me know if I can be of assistance.

Is there really “No Inventory”?

A common phrase that is being used right now to describe the market is ‘no inventory.’
‘There’s no inventory’ is said frequently among those inside and outside of the real estate industry.
The problem with this phrase is that it is untrue.
There is inventory. Meaning, there are a significant number of new listings hitting the market.
However, there is low standing inventory. Meaning, the listings that do hit the market don’t stick around for very long before they are purchased.
Standing inventory, which is the number of active properties on the market, is down roughly 70% along the Front Range.
However, the number of new listings coming on the market is essentially:
- Double compared to December 2020
- Only 20% to 25% less than this time of year in 2017, 2018, and 2019
So, there is inventory available, it just sells quickly because demand is historically high right now.
Calculating Risk with Home Values

The economic research blog called “Calculated Risk” just completed a fascinating study on home prices.
Specifically, they looked at the correlation between home price growth and inventory.
They used price data from the Case-Shiller Home Price Index and inventory data from the National Association of Realtors.
No surprise, they found that the lower the inventory the higher the home price growth. Also no surprise, as inventory goes up, price growth slows down.
This all correlates with simple economic rules of supply and demand.
The interesting part of their research is this: at a certain level of inventory, prices have the potential to go down.
That level, according to their research, is six months of inventory.
That means, prices don’t have a chance of decreasing in a market until there is at least 6 months of inventory available for sale.
To put that in perspective, today there is two weeks of inventory on the market along Colorado’s Front Range.
So, there would need to be 12 times the amount of homes for sale on the market for prices to even have a chance to go down.
Different Era, Different Market

Recently it seems there are many attempted comparisons being made between today’s real estate market and the 2006-2007 market.
It seems that people fear a repeat of what happened to the market in 2008 and 2009.
Buyers, understandably, want to make smart decisions and don’t want to buy in advance of any downturn.
The reality is this. There are some similarities between now and the pre-bubble market of 15 years ago. Namely, prices are appreciating quickly.
However, there is one massive difference.
The inventory of homes for sale right now is drastically different than 15 years ago.
The rules of economics tell us that, in order for prices to crash, demand needs to diminish, supply needs to swell, or some combination of the two.
Here’s the deal. Supply today is a fraction of what is was 15 years ago.
Homes for sale today:
- Larimer County = 238
- Weld County = 226
- Metro Denver = 2,594
Homes for sale 15 years ago:
- Larimer County = 2,998
- Weld County = 1,113
- Metro Denver = 29,045
The reason why prices flattened and decreased slightly along the Front Range in 2009 is because the National economy had a meltdown and there was a glut of supply.
We do not have anything similar to those same dynamics today.
We are watching the market closely every single day. While we don’t expect the current pace of appreciation to keep up, we believe inventory levels keep us insulated from any kind of crash.
