Contracts September 16, 2022

Contract Contingencies

Do YOU know the most common contingencies in the Colorado Real Estate Commission’s Contract? 🤔 If not, here they are. Take a look at some of the most common real estate contingencies below:
 
✅ Home Inspection Contingency
✅ Financing Contingency
✅ Appraisal Contingency
✅ Home Sale Contingency
✅ Title Contingency
Market Data September 15, 2022

Balancing Market?

Even though buyer demand has moderated and housing supply has increased in recent months, the market can still be considered a Seller’s Market because inventory is still low. 📉

According to data from NAR, sellers continue to benefit from competitive offers and serious buyers. In July, for example, the average home received 2.8 offers and 39% actually sold above the asking price. 💰

In other words, while the market is in fact cooling off, you certainly haven’t missed your chance to sell your home. Partner with a real estate professional today to get started on your home selling journey! 🏠

Buyers September 7, 2022

Tips For Homebuyers

💡 Strategically planning your home search by understanding current mortgage rates, keeping your options open, and working with a knowledgeable local real estate professional can be the key to finding your dream home.

EconomicMarket Data September 6, 2022

Latest Home Price Index Report

The latest Home Price Index report has just been released by the Federal Housing Finance Authority.

They track home price appreciation for the largest metropolitan areas in the U.S. plus state by state appreciation.

Here is the ranking of the top three states for price growth over the last twelve months:

1.  Florida = 29%

2.  Arizona = 26%

3.  North Carolina = 25%

The bottom three states are:

50.  North Dakota = 10%

49.  Louisiana = 11%

48.  Minnesotta = 11%

Colorado came in at #19 with 18% price growth over the last 12 months.

EconomicMarket Data August 28, 2022

New Home Trivia

Here’s a trivia question…

The number of new, single-family homes completed in 2022 will most closely resemble which prior year?

If you guessed 1993, you are correct.

Yes, the number of homes built and completed this year is no more than the number from 30 years ago.

In 2022, there will be just over 1 million single family homes constructed in the U.S. which is the same as 1993.

This is much more than the bottom of construction in 2011 which saw just under 500,000 new homes built.

But it is also much less than the top of 2006 which had almost 1.7 million.

Limited new home construction today is preventing anything close to a glut of inventory on the market which, in turn, insulates us from any sort of major price correction.

Market Data August 24, 2022

List Price > Sales Price?

For the first time in a long time, the sale to list price ratio is below 100%.

This statistic measures the final sales price versus the listing price.

During the super-active market of the last 24 months, this number averaged over 100%.

This was a result of multiple offers and bidding wars which caused buyers to offer more than list price.

Now, the sale to list price ratio has dropped to below 100% as a result of a more balanced market.

These are the specific numbers in each of our markets:

Larimer County = 98%

Weld County = 99%

Metro Denver = 97%

EconomicMarket Data August 23, 2022

2022 Q2 Real Estate Report

The following analysis of select counties of the Colorado real estate market is provided by Windermere Real Estate Chief Economist Matthew Gardner. We hope that this information may assist you with making better-informed real estate decisions. For further information about the housing market in your area, please don’t hesitate to contact your Windermere Real Estate agent.


Regional Economic Overview

Colorado continues to add jobs, but the pace of growth has slowed, albeit modestly. At the time of writing this report, the state’s employment had increased by 124,600 jobs over the past 12 months, which represents an annual growth rate of 4.6%. The state unemployment rate in May was 3.5%. Regionally, unemployment rates ranged from a low of 2.4% in Boulder to a high of 3.4% in the Grand Junction and Greeley metropolitan areas.

Colorado Home Sales

❱ In the second quarter, 12,839 homes sold, a drop of 8% compared to a year ago but 57% higher than in the first quarter of this year.

❱ Year over year, sales rose in only three counties covered by this report and fell in the rest of the region. That said, there was a palpable increase in sales across the board compared to the first quarter of 2022.

❱ The significant jump in sales from the first quarter can likely be attributed to the fact that inventory levels spiked, rising more than 190% from the first quarter.

❱ Pending sales (an indicator of future closings) rose 39% from the first quarter, signifying that the third quarter may show further growth in sales activity.

A bar graph showing the annual change in home sales for various counties in Colorado from Q2 2021 to Q2 2022. The counties with a positive percentage year-over-year change are Clear Creek at 30.8%, El Paso at 3.2%, and Park at 1.7%. Gilpin County had a 0% change. The counties with a negative year-over-year change are Adams at -3.4%, Arapahoe at -4.2%, Jefferson at -5.7%, Weld at -7.4%, Denver at -9%, Larimer at -10.6%, Douglas at -16.7%, and Boulder at -20.2%.

Colorado Home Prices

❱ The average home sale price ($700,369) was 14.1% higher than the same period in 2021. Prices were also 9.8% higher than in the first quarter of this year.

❱ Price growth remains strong even in the face of significantly higher inventory levels and mortgage rates, which is an impressive achievement.

❱ Year over year, prices rose by double digits across all markets except El Paso and Arapahoe counties. Prices rose in all counties other than Gilpin (-10.3%) and Clear Creek (-1%) from the first quarter.

❱ With the increase in mortgage rates and the number of homes for sale, I have started to watch list prices more closely. Compared to the first quarter, median list prices are lower in 9 of the 12 counties included in this report. Although it’s too early to say whether this is a trend we should be worried about, I will be watching how prices move during the summer, as it may be an indicator that the market is starting to soften.

A map showing the real estate home prices percentage changes for various counties in Colorado. Different colors correspond to different tiers of percentage change. El Paso and Arapahoe Counties are the only counties with a percentage change in the 7% to 10.9% range, Boulder and Gilpin counties are in the 11% to 14.9% change range, Larimer, Weld, Adams, Park, Jefferson, and Douglas are in the 15% to 18.9% change range, Denver County is in the 19% to 22.9% change range, and Clear Creek County is the sole county in the 23% + change range.

A bar graph showing the annual change in home sale prices for various counties in Colorado from Q2 2021 to Q2 2022. Clear Creek County tops the list at 23.7%, followed by Denver at 22.3%, Larimer at 18.6%, Douglas at 16.4%, Park at 16.2%, Weld at 15.5%, Adams at 15.2%, Jefferson at 15.1%, Gilpin at 14.2%, Boulder at 11.3%, Arapahoe at 9.9%, and finally El Paso at 7.9%.

Mortgage Rates

Although mortgage rates did drop in June, the quarterly trend was still moving higher. Inflation—the bane of bonds and, therefore, mortgage rates—has yet to slow, which is putting upward pressure on financing costs.

That said, there are some signs that inflation is starting to soften and if this starts to show in upcoming Consumer Price Index numbers then rates will likely find a ceiling. I am hopeful this will be the case at some point in the third quarter, which is reflected in my forecast.

A bar graph showing the mortgage rates from 2020 to the present, as well as Matthew Gardner's forecasted mortgage rates through Q2 2023. He forecasts mortgage rates continuing to climb to 5.9% in Q4 2022, then tapering off to 5.58% in Q1 2023 and 5.53% in Q2 2023.

Colorado Days on Market

❱ The average time it took to sell a home in the markets contained in this report fell eight days compared to the same period in 2021.

❱ The length of time it took to sell a home dropped in six counties, remained static in three, and rose in the other three compared to the same quarter a year ago.

❱ It took an average of only 10 days to sell a home in the region, which is down 15 days compared to the first quarter of the year.

❱ Compared to the first quarter of 2022, average market time fell across the board, with significant drops in Gilpin (-41 days), Park (-25 days), and Clear Creek (-23 days) counties.

A bar graph showing the average days on market for homes in various counties in Colorado for Q2 2022. Arapahoe, Adams, and Jefferson Counties have the lowest DOM at 7, followed by Denver, Douglas, and Clear Creek at 8, El Paso at 9, Larimer at 10, Weld and Boulder at 11, Gilpin at 12, and Park at 17.

Conclusions

This speedometer reflects the state of the region’s real estate market using housing inventory, price gains, home sales, interest rates, and larger economic factors.

The Colorado economy remains robust and continues to grow. As it stands today, I anticipate income growth here will continue to outpace the nation. The 221,000 current job openings in the state are evidence of significant employer demand, which will lead to higher wages. Housing demand is still remarkably strong, even in light of the rapid increase in the number of homes for sale and rising financing costs.

A speedometer graph indicating a medium seller's market in Colorado for Q2 2022.

As mentioned earlier, I will be watching movement in list prices through the summer as they are a leading indicator in respect to the health of the market. Although we saw some softening in the pace of regional list price growth during second quarter and median list prices pulling back in some markets, it is too early to state that this is a pattern. As such, I am leaving the needle in the same position as the first quarter. The growing number of homes for sale and lower list prices in some markets should favor buyers, but this is offset for the time being by solid demand.

About Matthew Gardner

Matthew Gardner - Chief Economist for Windermere Real Estate

As Chief Economist for Windermere Real Estate, Matthew Gardner is responsible for analyzing and interpreting economic data and its impact on the real estate market on both a local and national level. Matthew has over 30 years of professional experience both in the U.S. and U.K.

In addition to his day-to-day responsibilities, Matthew sits on the Washington State Governors Council of Economic Advisors; chairs the Board of Trustees at the Washington Center for Real Estate Research at the University of Washington; and is an Advisory Board Member at the Runstad Center for Real Estate Studies at the University of Washington where he also lectures in real estate economics.

EconomicMarket Data August 5, 2022

Recessions & Real Estate

Our clients wonder what a recession would mean for the real estate market.

Many assume it would translate into a downturn in prices.

Some even worry that it would cause values to come crashing down.

We looked back in history, at past recessions, to gain an understanding of what recessions mean for the Front Range market.

We used the extensive data from the Federal Housing Finance Authority to look at home price appreciation during the five recessions dating back to 1981.

What we found was quite interesting.

During the five recessions of 1981, 1990, 2001, 2008 and 2020, home prices along the Front Range went up in all but the 2008 recession.

What was unique about 2008 was that housing led the recession.  Whereas the other recessions were triggered by some combination of inflation, oil prices, and stock market issues (plus the pandemic in 2020).

So, if the past is an indicator of the future, a recession is not guaranteed to result in lower real estate prices.

The Front Range real estate market has always demonstrated long-term health and a great resiliency to outside economic events.

See the chart below for the detailed research…

Market DataTroutman ParkUncategorized July 20, 2022

Troutman Park Real Estate Review Q2


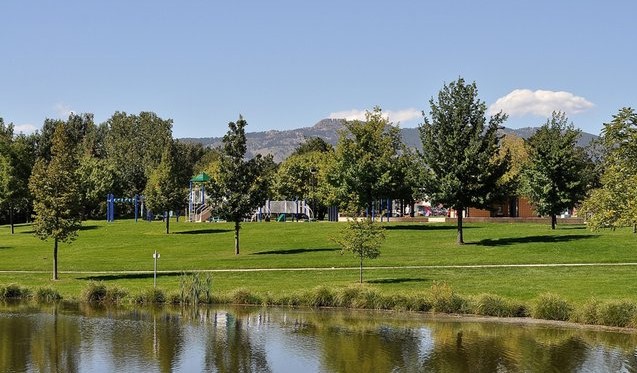
Now that we’re half way through 2022 we can take a look at our Real Estate Market and what we’re starting to see is transition. This is what we’re seeing consistently throughout Colorado’s Front Range. The fact of the matter is that Northern Colorado consists of many different hyper-local markets though. So with that in mind let’s take a look at how our local market right here in Troutman Park compares to previous years.

Here is what Troutman Park’s Real Estate market has done through the 1st half of 2022 and compare it to the same time during other recent years. Here are the numbers:

2022 Q1-Q2 – 24 homes sold for $12,775,100. They ranged from $407,500 – $752,00 at an average of $532,295

2021 Q1-Q2 – 31 homes sold for $14,614,420. They ranged from $371,000 – $630,000 at an average of $471,432

2020 Q1-Q2 – 30 homes sold for $11,727,425. They ranged from $325,000-$507,000 at an average of $390,914

2019 Q1-Q2 – 33 homes sold for $12,724,583. They ranged from $320,000-$477,900 at an average of $385,593

2018 Q1-Q2 – 24 homes sold for $8,813,900. They ranged from $290,000-$465,000 at an average of $367,245

2017 Q1-Q2 – 25 homes sold for $8,594,519. They ranged from $257,500-$443,000 at an average of $343,780

2016 Q1-Q2 – 27 homes sold for $8,645,100. They ranged from $205,000-$436,000 at an average of $327,000

2015 Q1-Q2 – 36 homes sold for $10,185,745. They ranged from $218,325-$355,000 at an average of $282,937


Last year at this time there were 10 homes in the neighborhood that sold at $500,000 or more (3 of those were between $601,000 and $630,000). In the 1st half of 2022 there were 16 homes in Troutman Park that sold for more than half a million. Our neighborhood also saw a new all time high in value when 319 Mapleton Ct sold for $752,000 on June 16. The average price in Troutman Park is up 13% over the 1st half of last year’s average.

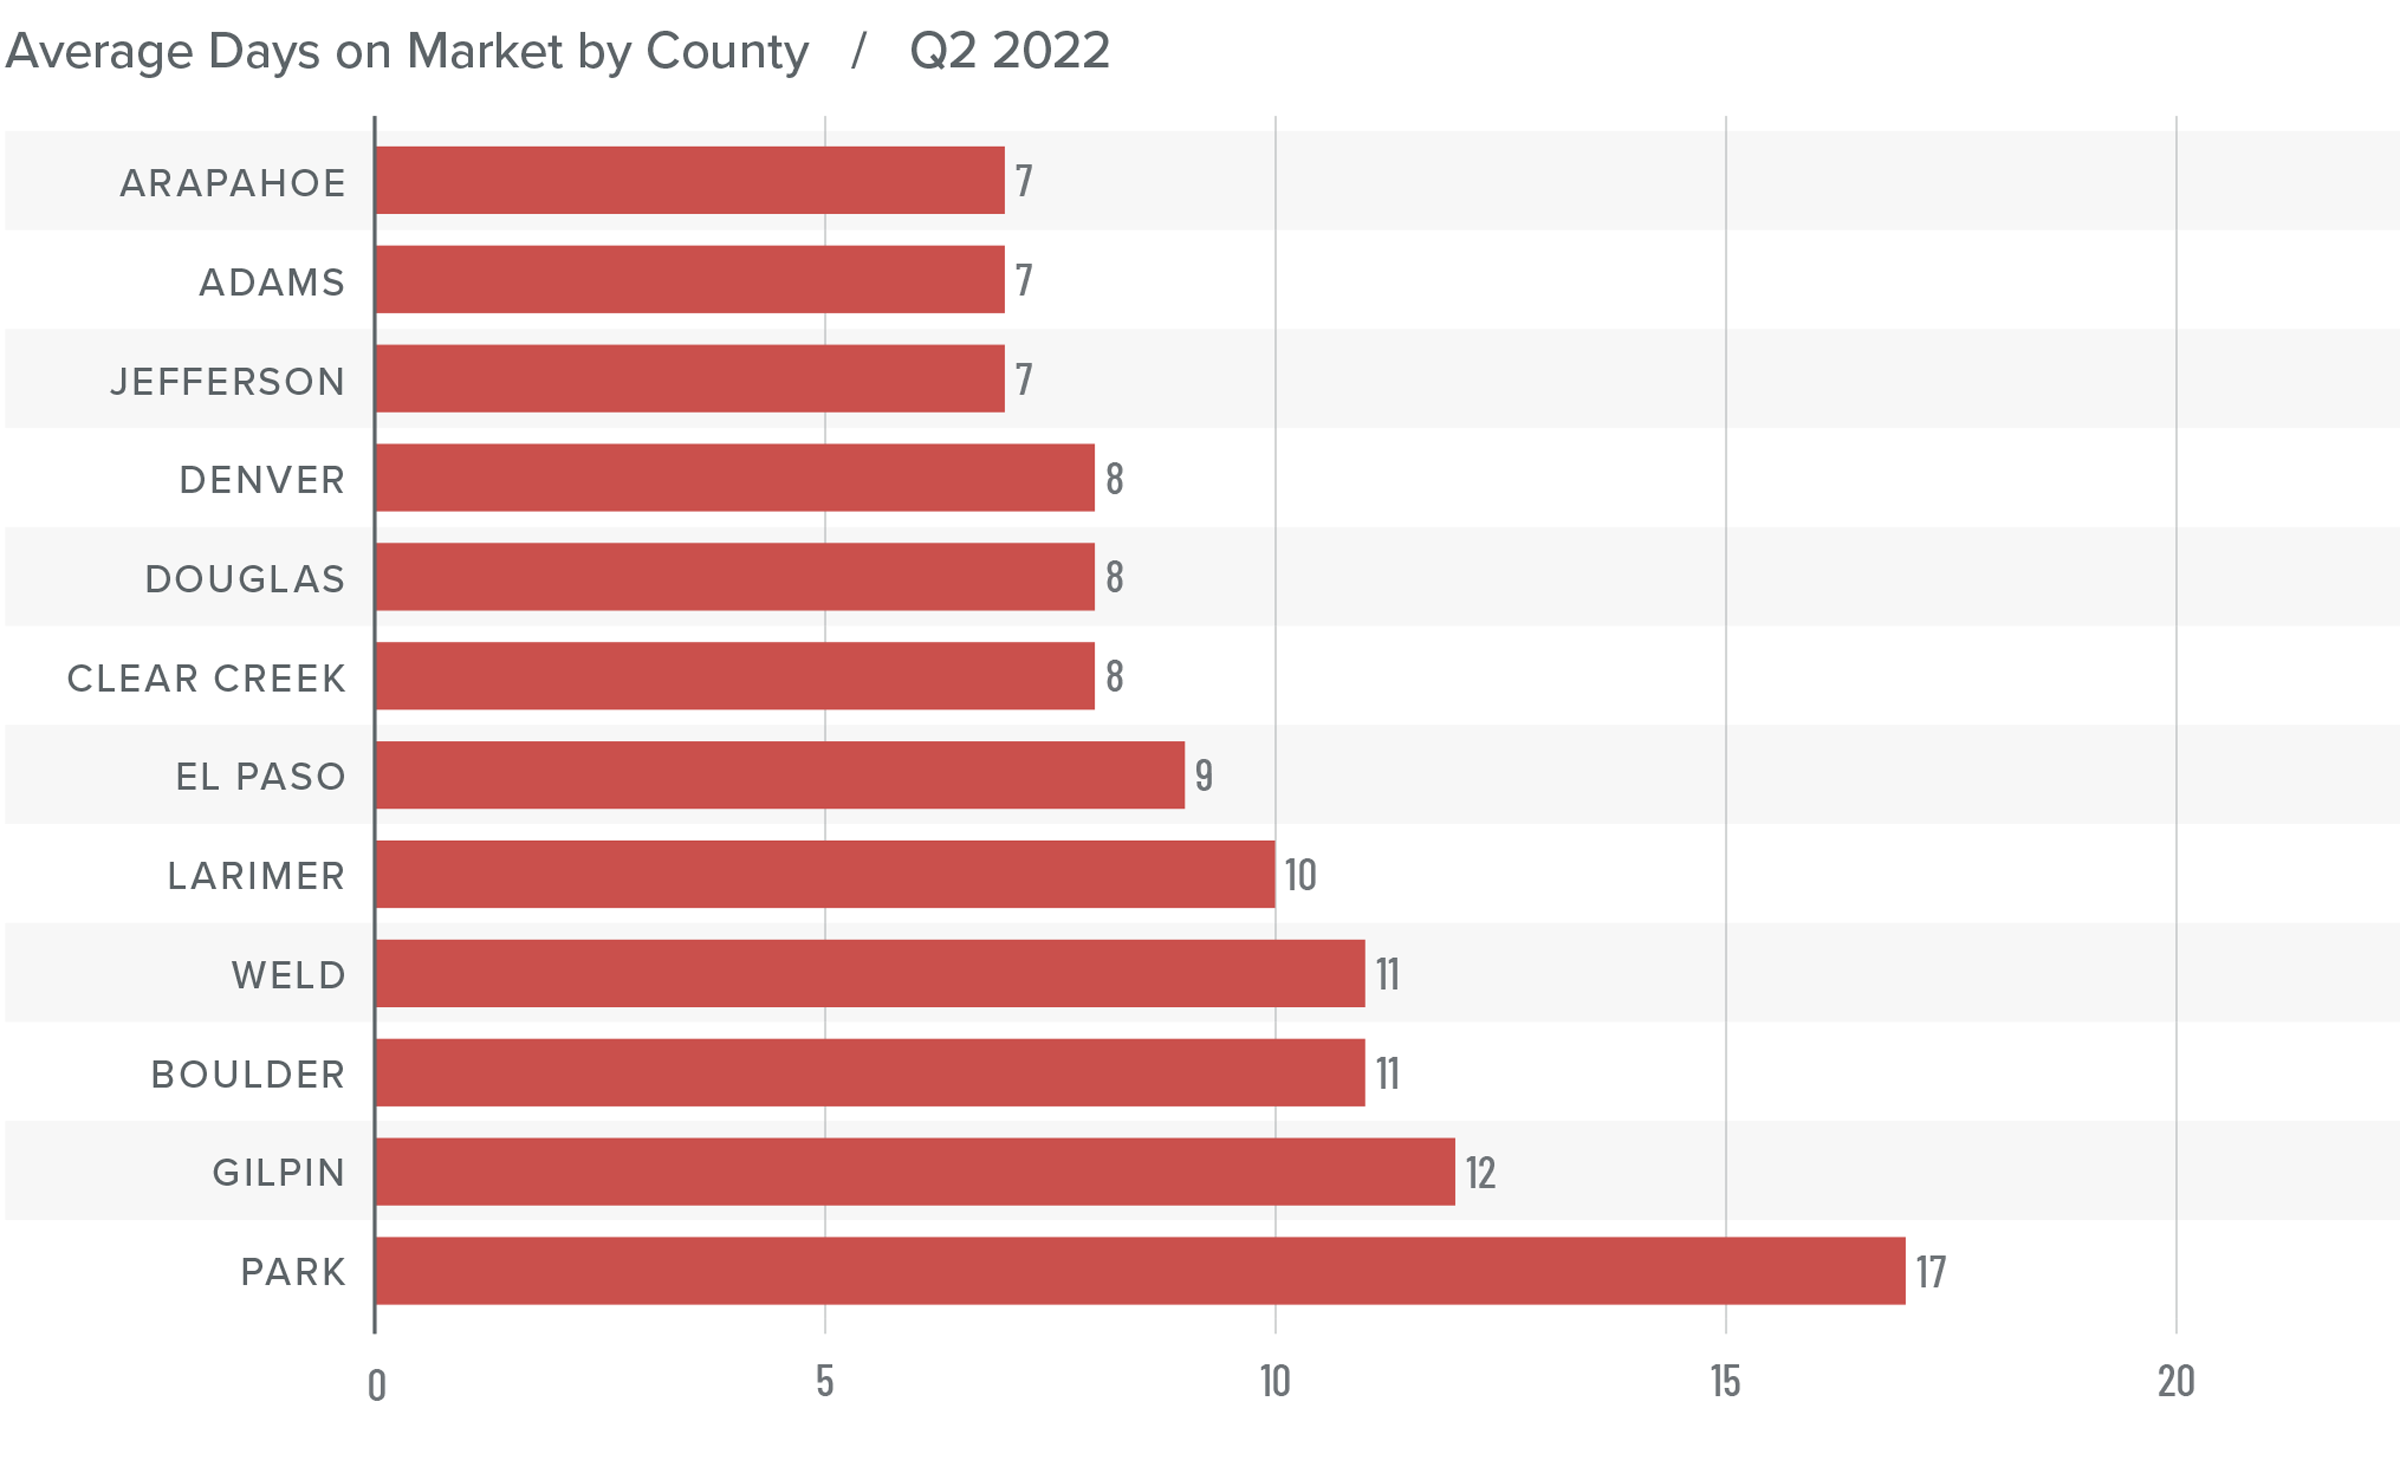
The average days on the market before going under contract for Troutman Park properties is 8 days for the 1st half of 2022. That’s up just one day from last year at this time. We’ll likely see that number go up a few days in the 2nd half of the year however.

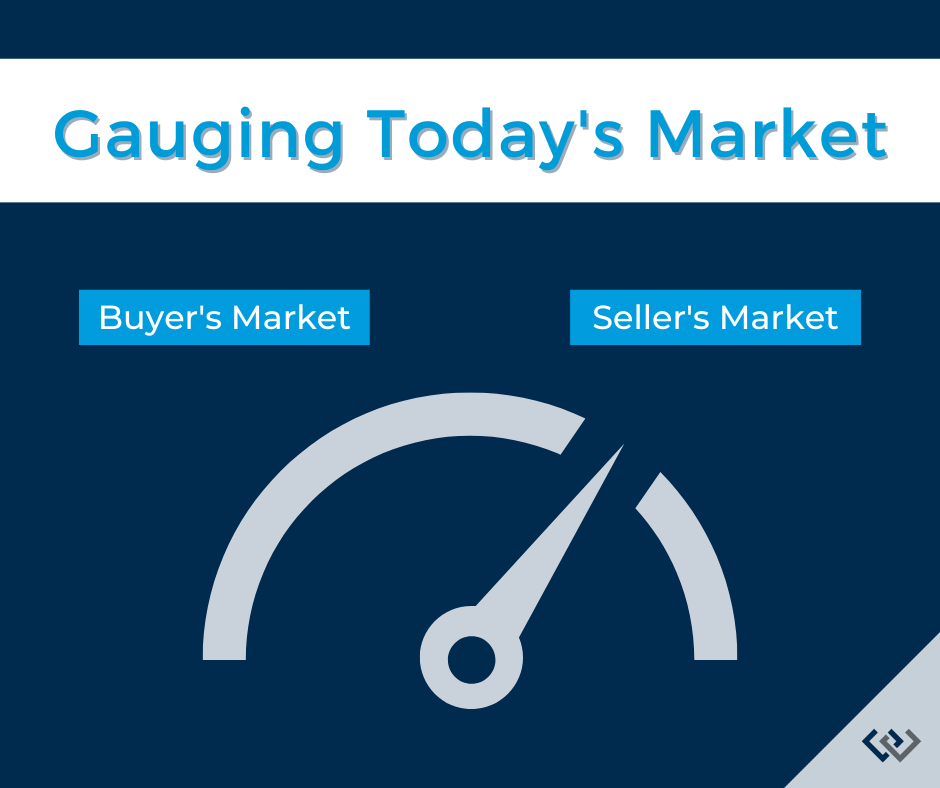
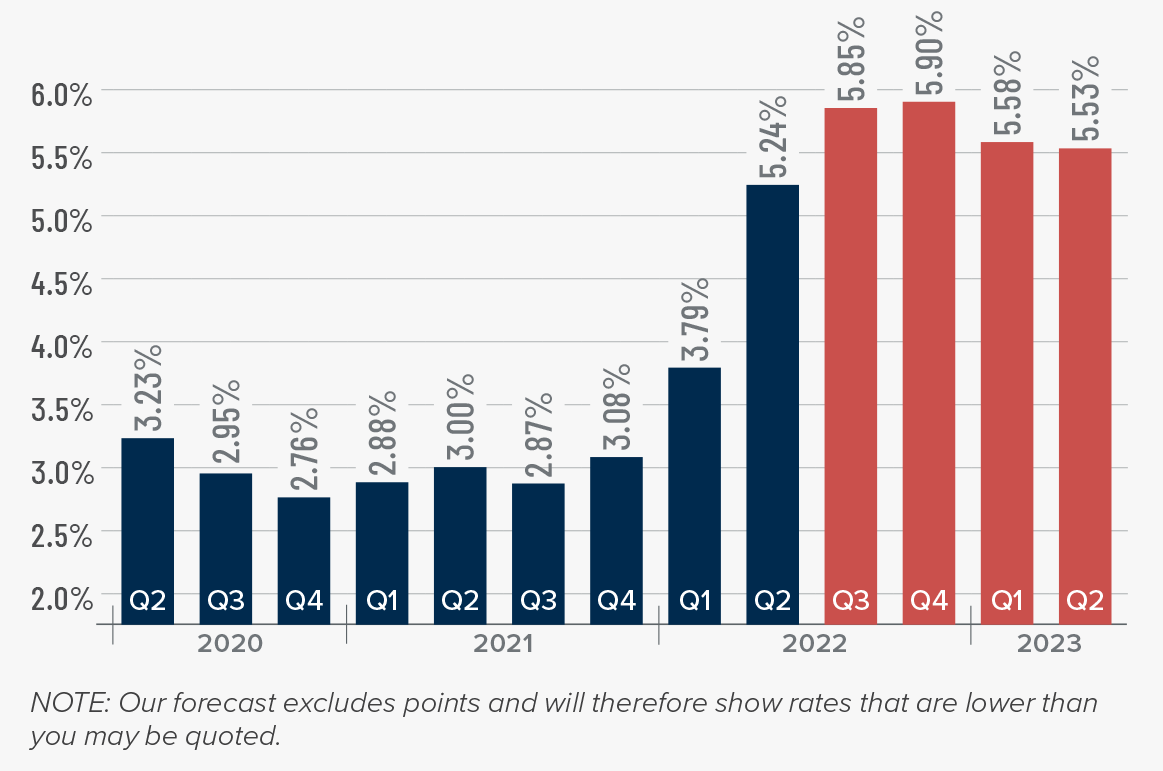
What we’re seeing across all Colorado’s Front Range is a transition in our real estate market. We have gone from an all time low of inventory (2 weeks supply) in the 1st quarter of the year to what we see as 1.5 months supply now. When the interest rates started to rise in March some buyers started to head to the sidelines. When May and June rolled around we also started to notice a significantly higher number of homes for sale on the market.

For those who worry that we’re on the edge of a bubble keep in mind that economist say there is not a chance of values dropping until there are 6 or months of inventory on the market. Right now we are at 1.5 months supply of inventory. The tides are starting to change though and sellers don’t have nearly as much leverage in negotiations right now compared to last year or the beginning of 2022. The nicely remodeled “Move In Ready” homes may still have more than 1 offer competing for them. It will probably be more like a 2-4 offer situation now though compared to places that were seeing somewhere in the neighborhood of up to 20 offers earlier in the year.

The other factor we notice right now is something we see most every year. That’s the seasonal slow down in buyer activity from July through early September. One reason we see this is the families that are putting their search on the back burner while on vacation and then getting ready for back to school.

The end result means sellers are still in demand but there is a lot more opportunity for buyers now as there isn’t nearly as much competition as there was at the beginning of the year. Some buyers may be able to negotiate having sellers pay concessions towards buying down the interest rate which can be a big Win/Win situation.

If you have questions about anything or if you’re curious about what your home might be worth, just let me know. I grew up here in Fort Collins, I’ve worked in Real Estate since 2002. I live right here in Troutman Park and I’m always happy to share.

Market Data May 13, 2022

Home Inventory Increasing?

In Front Range markets, the number of homes for sale has just hit bottom or is about to hit bottom.

This is terrific news for home buyers who have been waiting for more homes to choose from.

The market is shifting, there is no doubt about that.

Prices are still increasing and we expect them to increase, just not at the pace they have been.

The inventory of homes for sale, which has been significantly down for two years, is finally starting to show signs of change.

We have been accustomed to inventory levels being down 30% to 50% compared to the prior year.

That is not the case anymore.

Inventory in Larimer and Weld County is now only down roughly 5% year over year.

Inventory in Metro Denver is now up 13.5% compared to this time in 2021.

We believe this is a legitimate shift in the market, not just a short-term anomaly.

No need to worry about prices crashing or a housing bubble.  There is still too little supply and too much demand for that to happen.

However, the pace of price of appreciation will certainly get back to more normal levels of 5% to 6% per year instead of 20% to 25% per year.

Bottom line, this market shift has been a long time coming and is very good news for buyers.​​​​​​​