Facebook
 Twitter
 Pinterest
 Copy Link

The following analysis of select counties of the Colorado real estate market is provided by Windermere Real Estate Chief Economist Matthew Gardner. We hope that this information may assist you with making better-informed real estate decisions. For further information about the housing market in your area, please don’t hesitate to contact your Windermere Real Estate agent.
Regional Economic Overview
The pace of employment growth in Colorado continues to slow. Though this is not totally unexpected, I will be keeping an eye on it as annual job growth has now fallen below the long-term trend. Over the past year, the region added 46,700 jobs, which is the slowest annual pace since 2012. Part of the reason job growth has slowed so significantly is that the labor market remains extremely tight; the unemployment rate in February was only 2.9%. Regionally, jobless rates ranged from a low of 2.7% in Fort Collins and Boulder to a high of 3.4% in the Grand Junction metropolitan area.
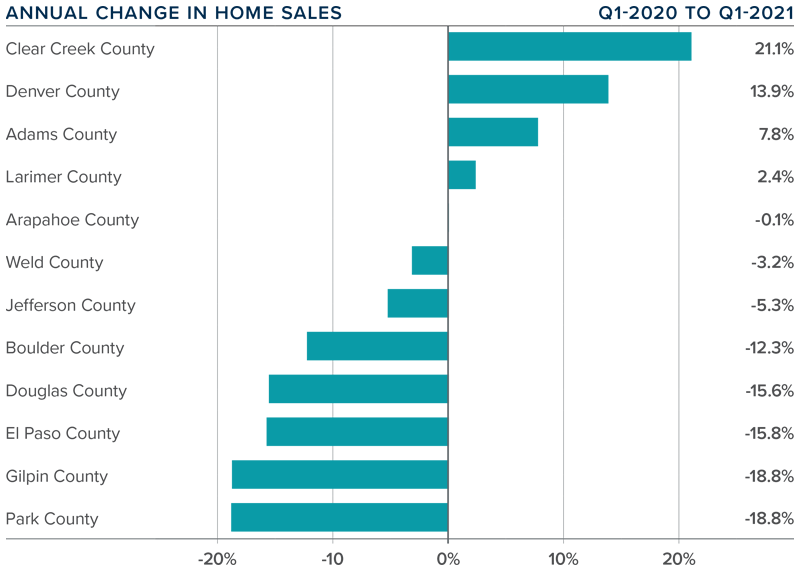
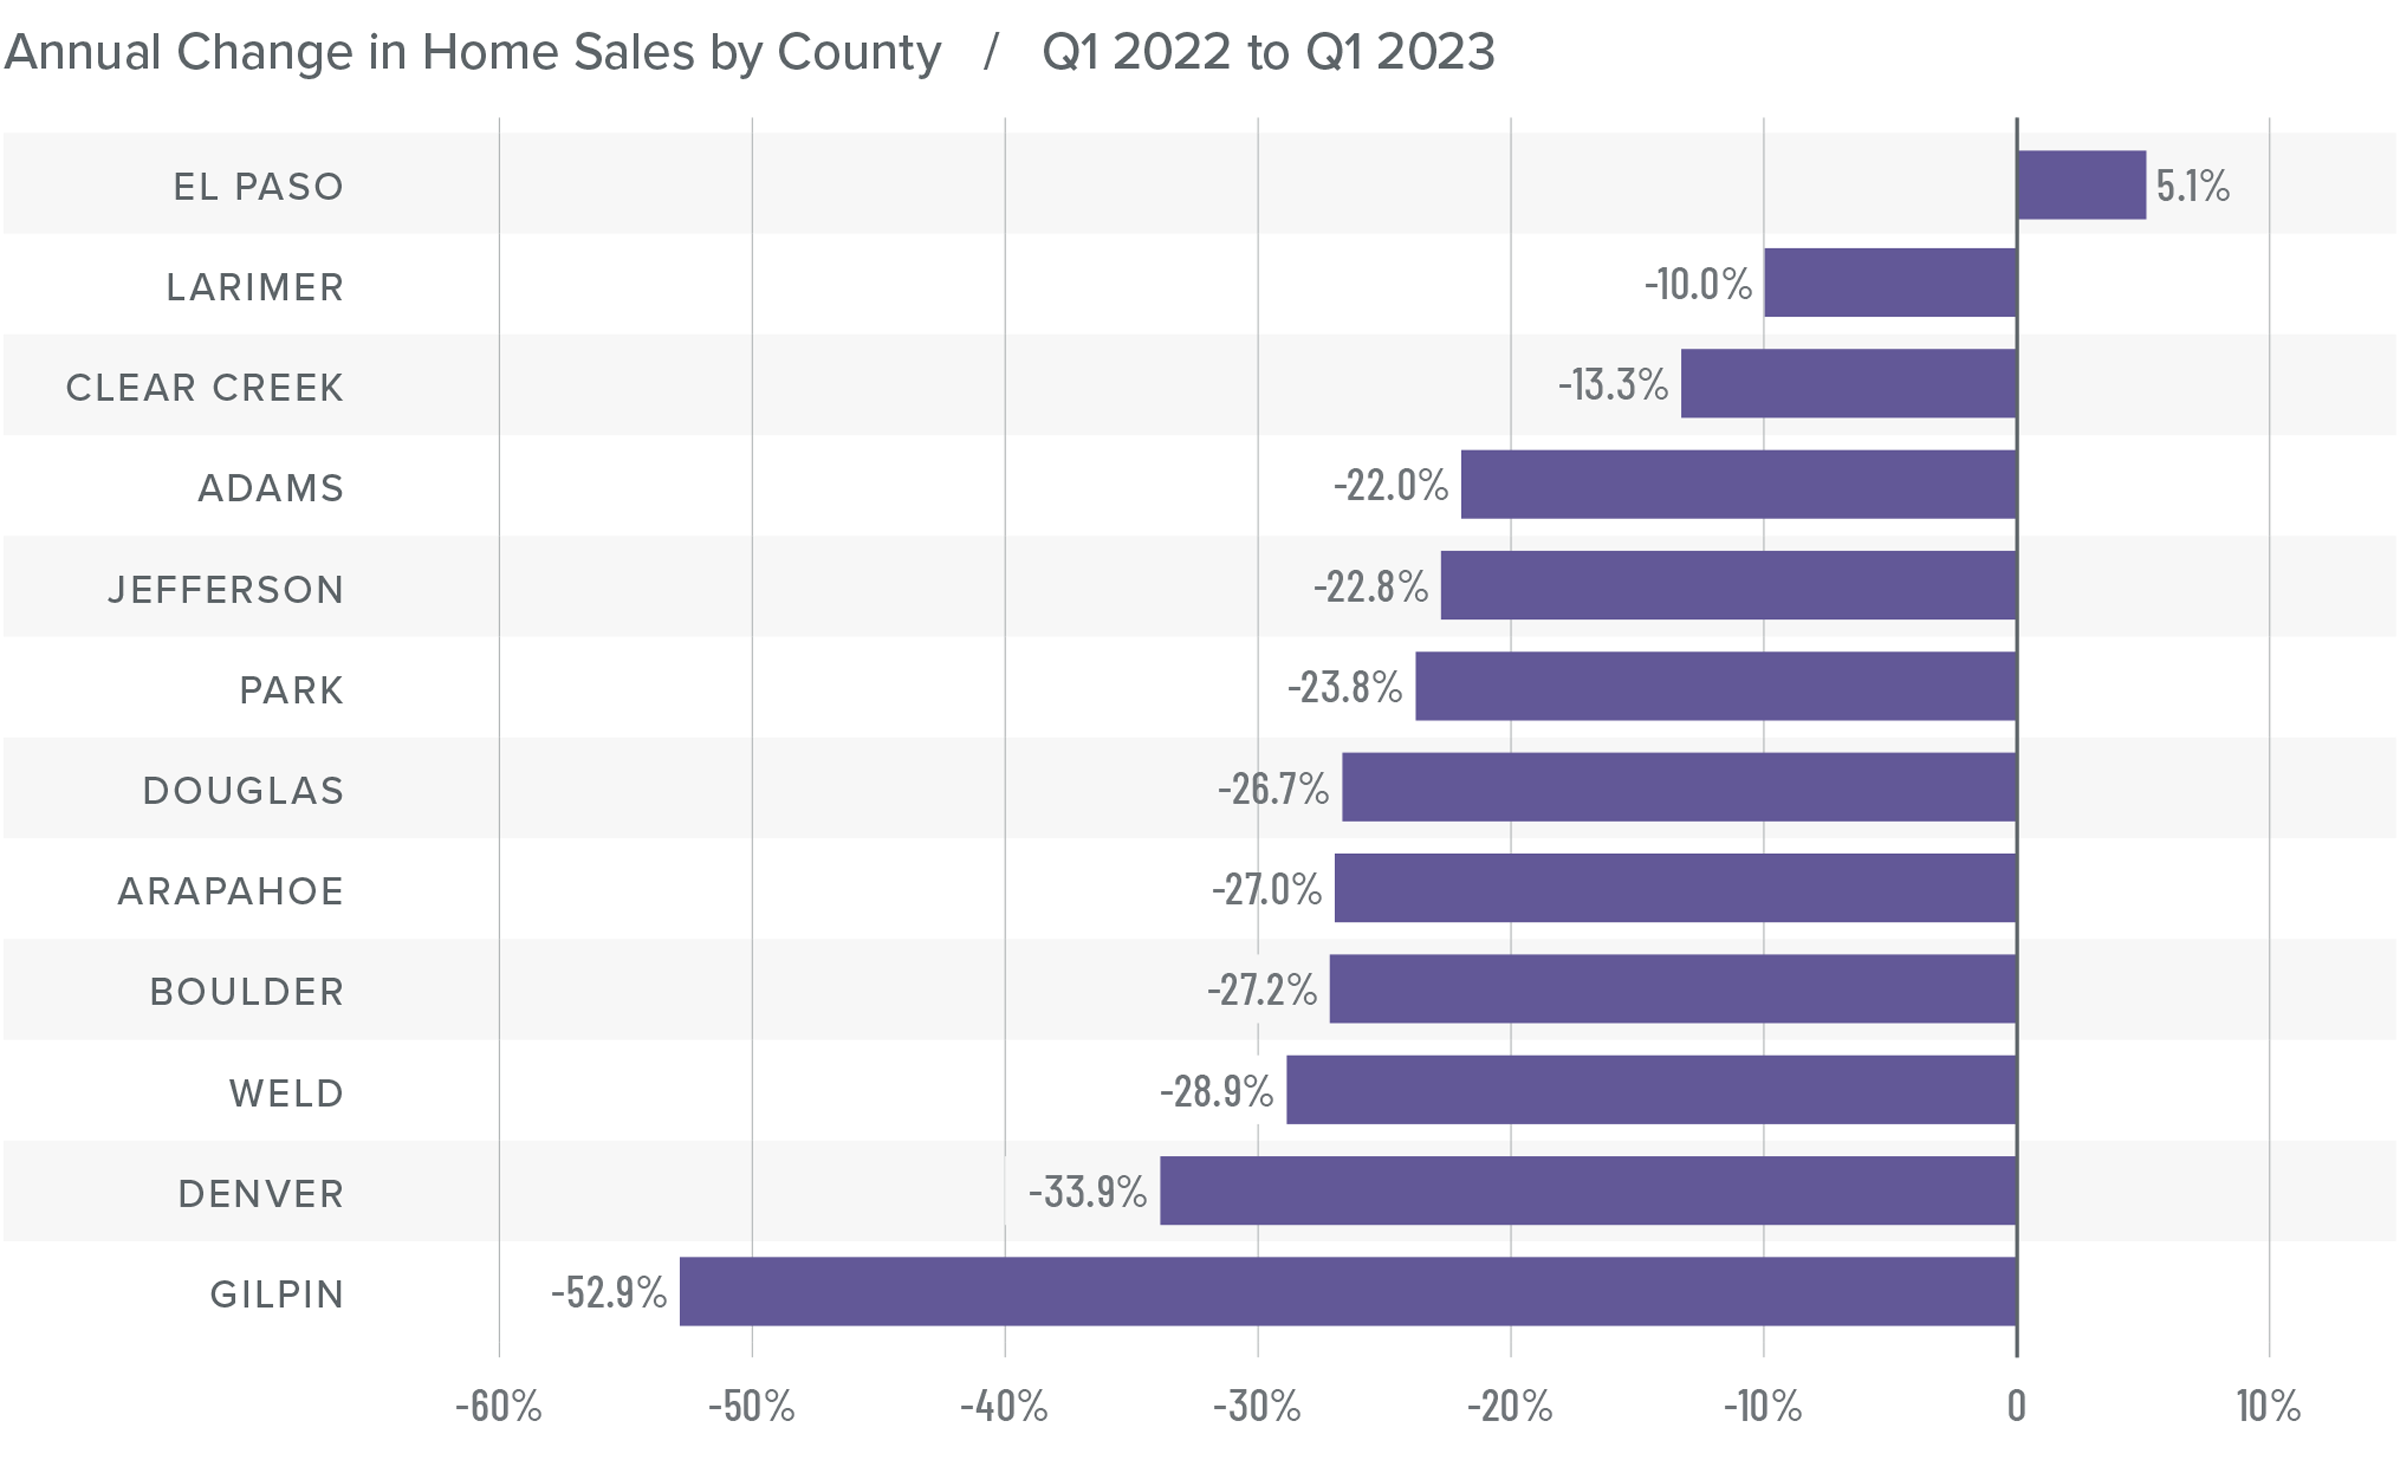
Colorado Home Sales
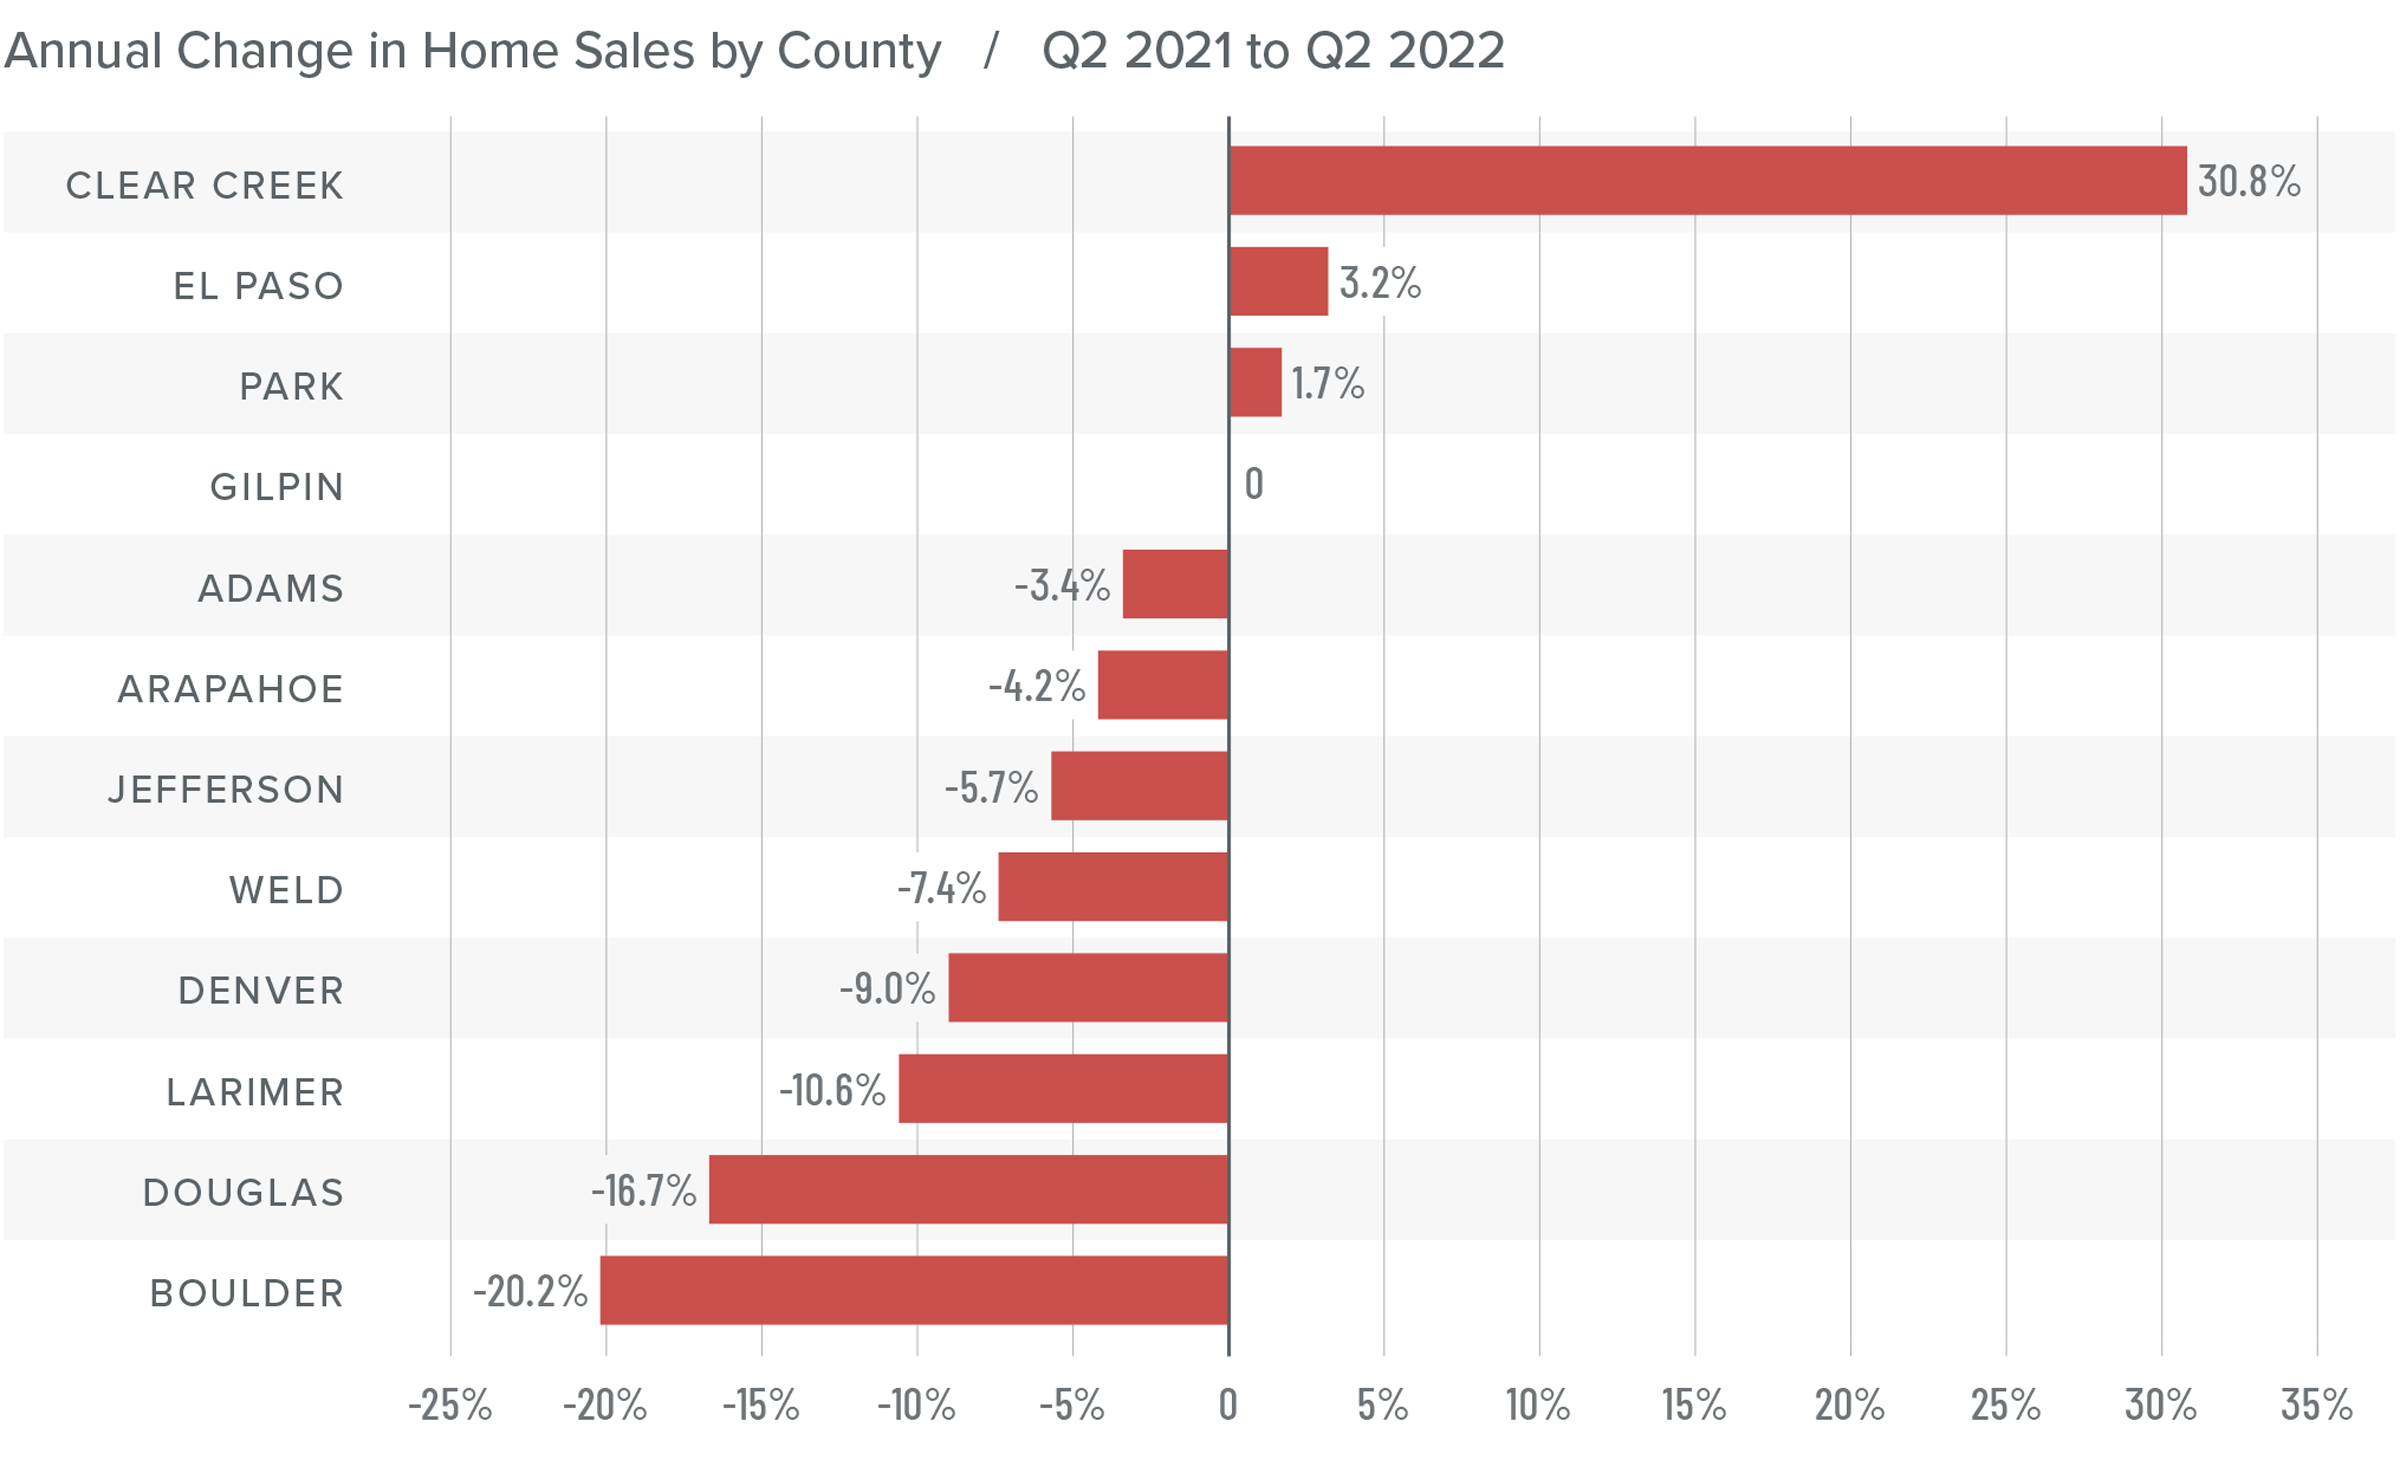
❱ In the first quarter of 2023, 6,545 homes sold, representing a fall of 23.9% from the same period in 2022. Sales were down 8.4% from the final quarter of 2022.
❱ Year over year, sales fell across all the markets covered by this report except El Paso. Compared to the fourth quarter of 2022, sales fell in all markets except Douglas County, where they rose 2.7%.
❱ The year-over-year decline in sales is not surprising given that mortgage rates started to rise in early 2022, causing a flood of buyers to lock in historically low rates while they could. The quarter-over-quarter sales decline was likely due to the 38.9% drop in active listings, as well as seasonal factors. The market remains tight.
❱ Pending sales, which are an indicator of future closings, jumped 31.8% from the fourth quarter of 2022, suggesting that sales may improve in the second quarter.
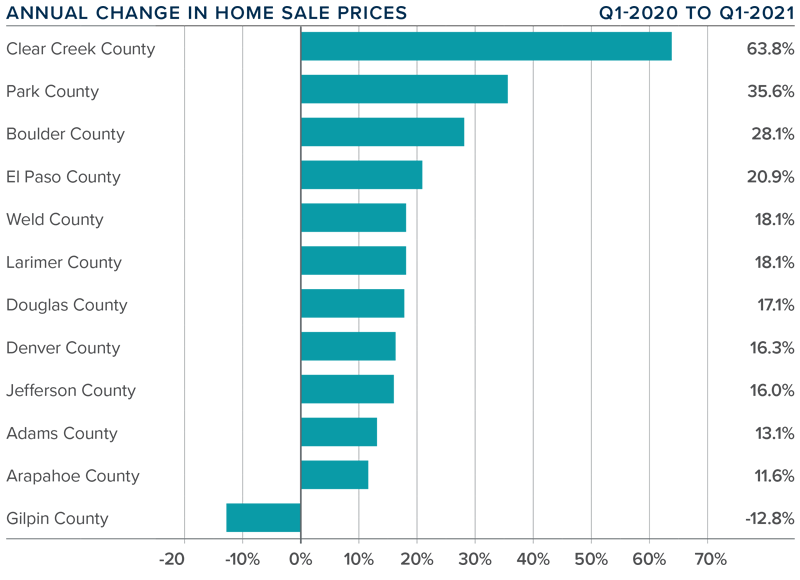
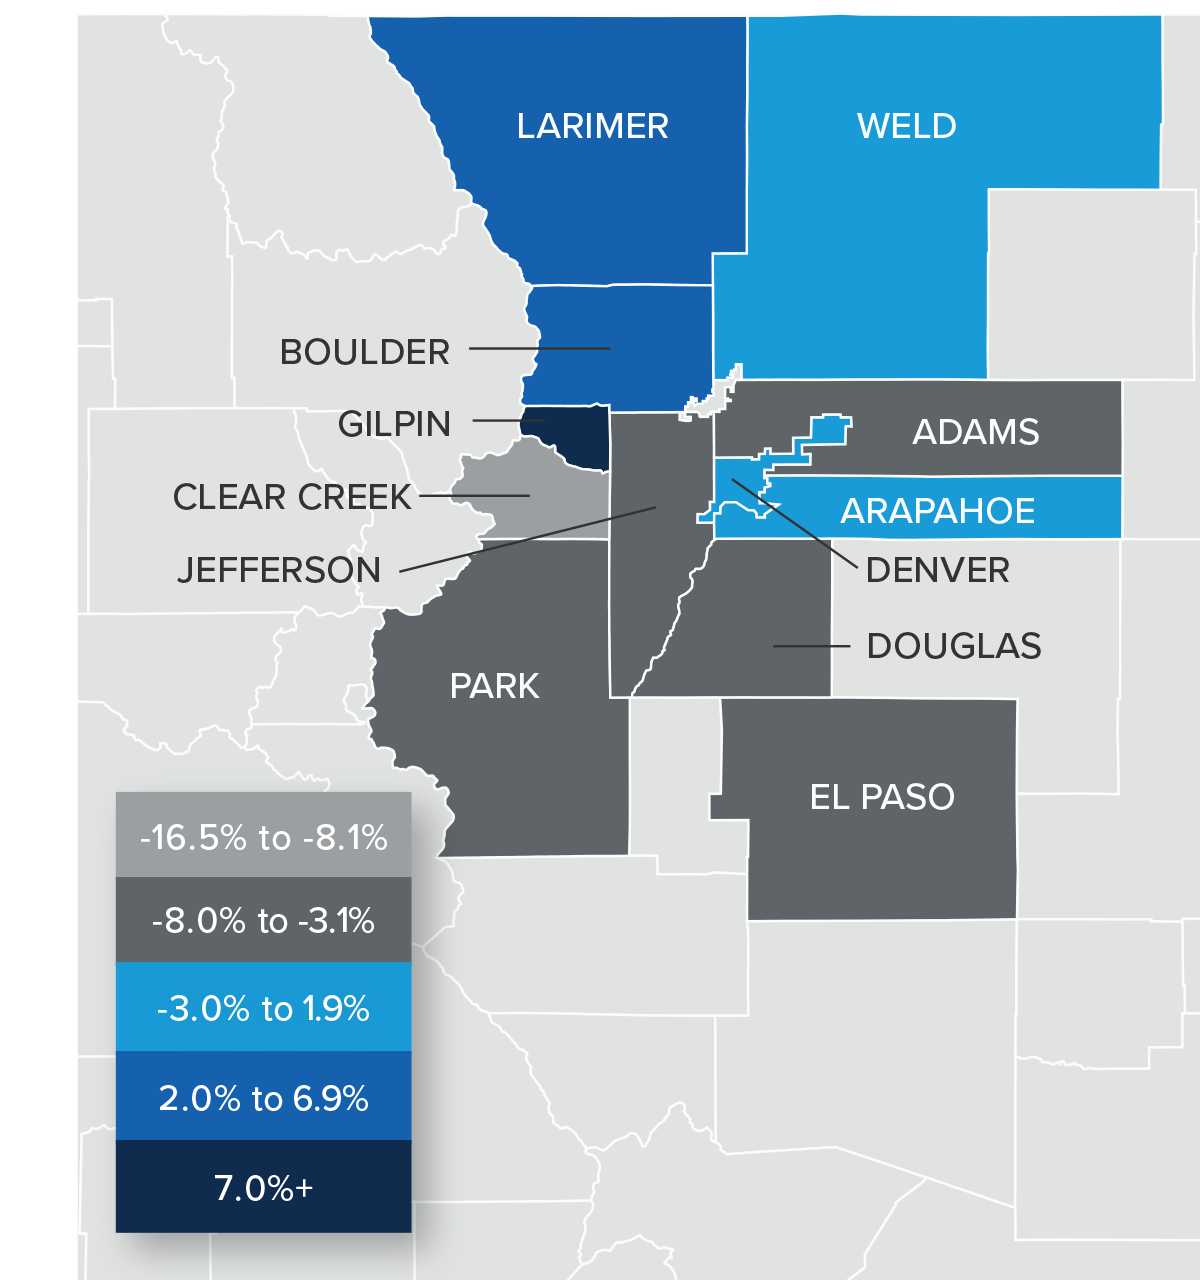
Colorado Home Prices
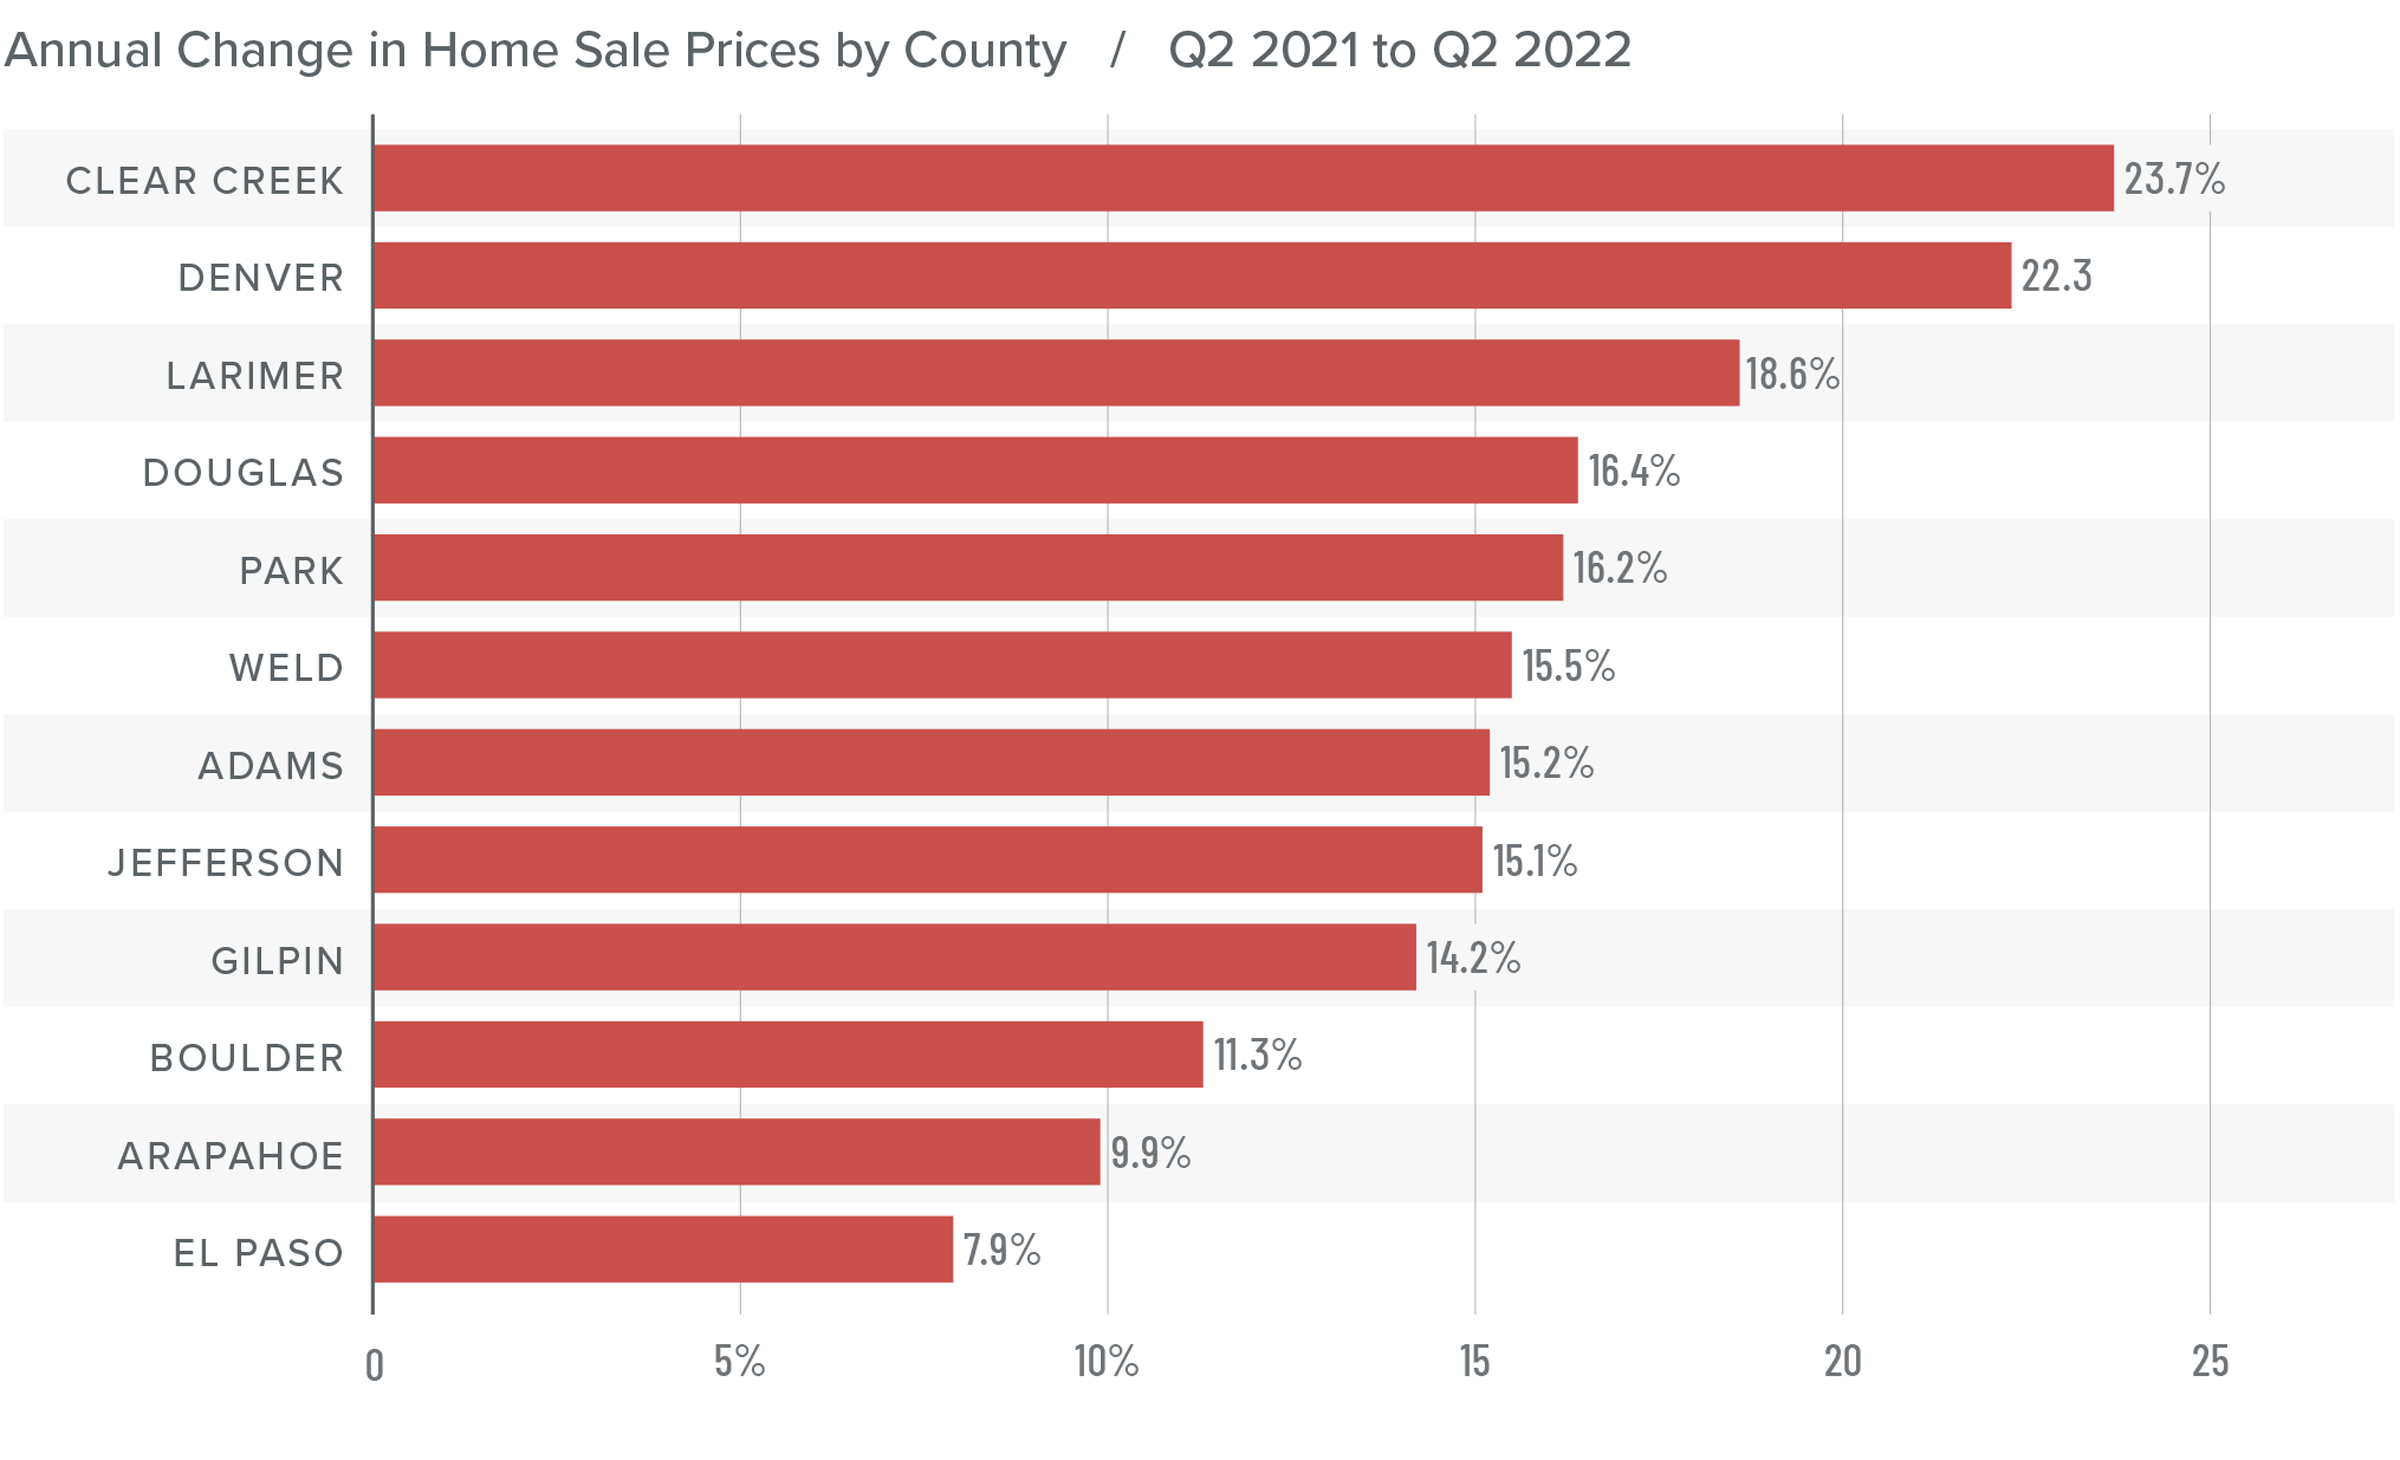
❱ The average home price fell 1.8% from the same period in 2022 to $625,213. Prices were .4% lower than in the fourth quarter of 2022.
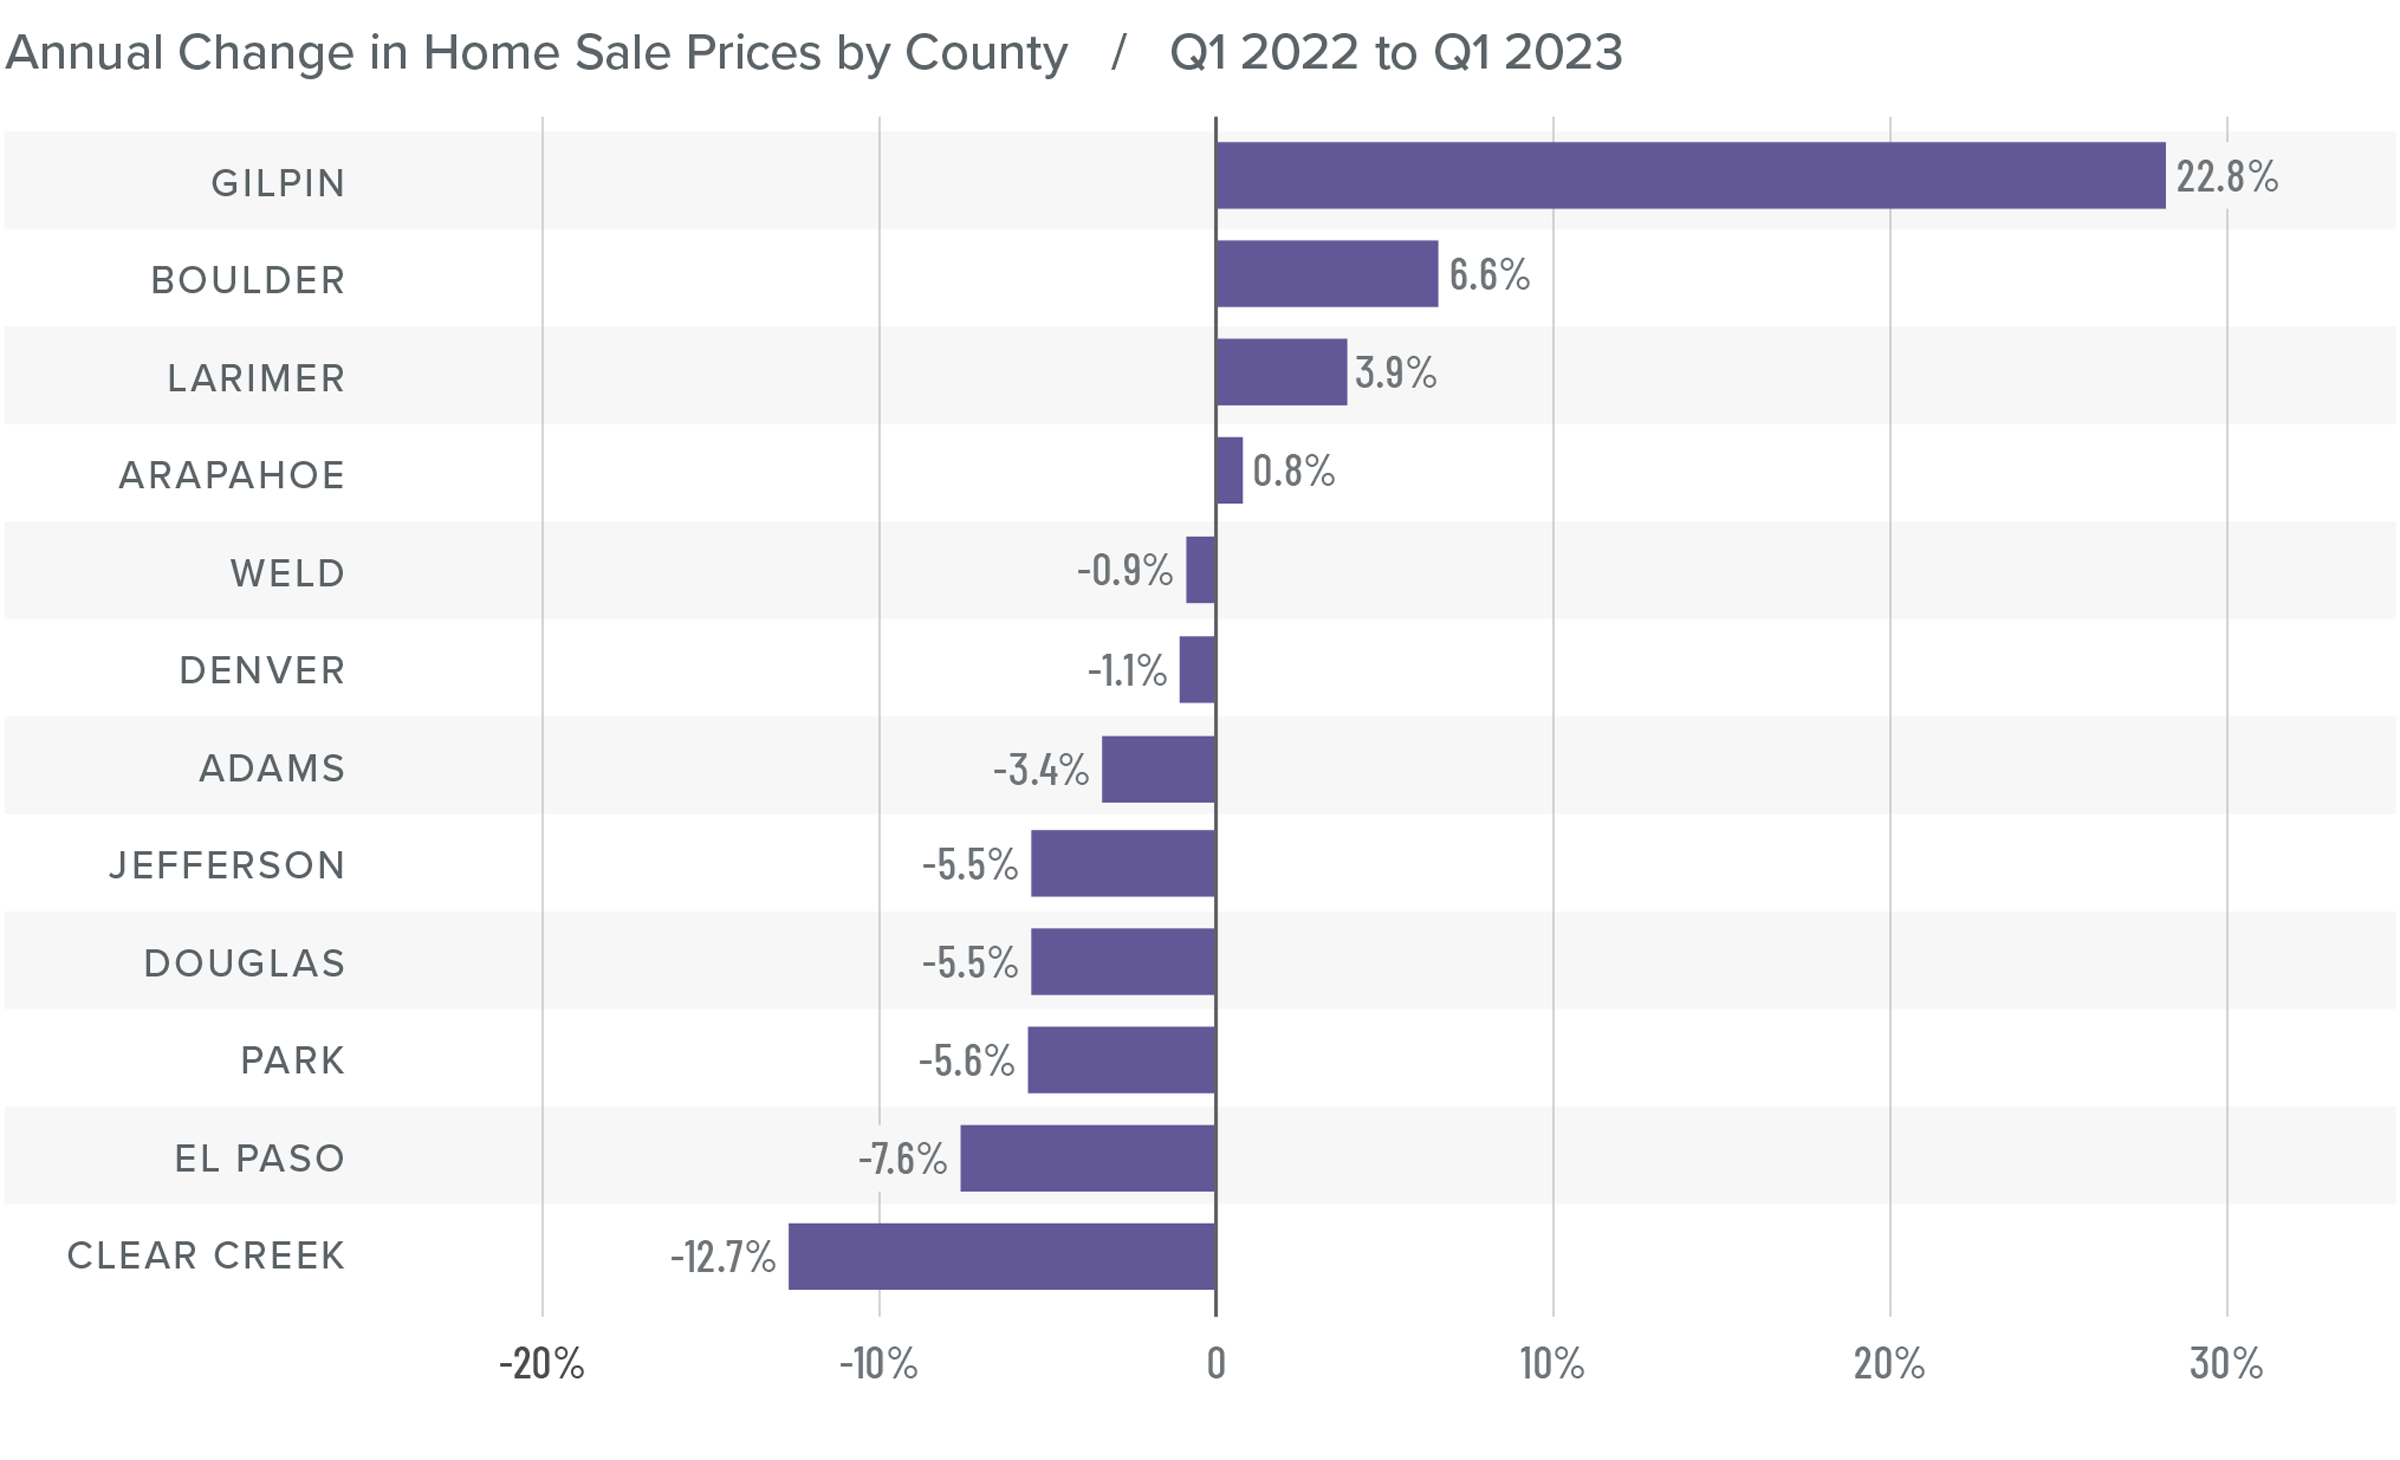
❱ Compared to the final quarter of 2022, prices rose in Jefferson, Arapahoe, Boulder, Larimer, Gilpin, and Park counties, but fell in the other market areas.
❱ Year over year, prices rose in four counties, but fell in the rest of the markets. Home prices in Gilpin County rose dramatically, but the small size of this market makes it prone to significant swings.
❱ Median listing prices rose 3% compared to the fourth quarter of 2022, suggesting that sellers are not overly concerned by higher financing costs. The fact that both listing prices and sale prices are not falling tells me that the price correction that followed the jump in mortgage rates is likely coming to an end.
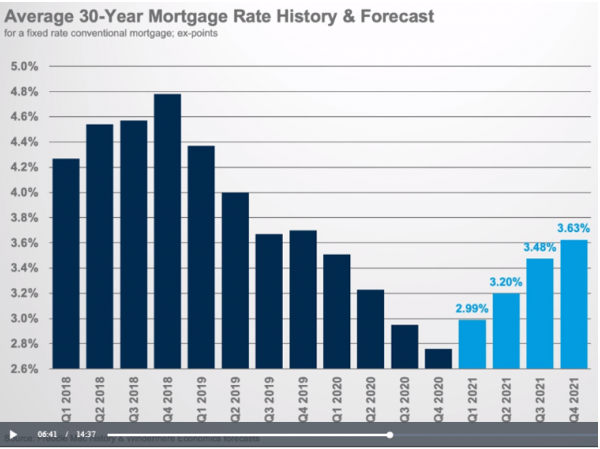
Mortgage Rates
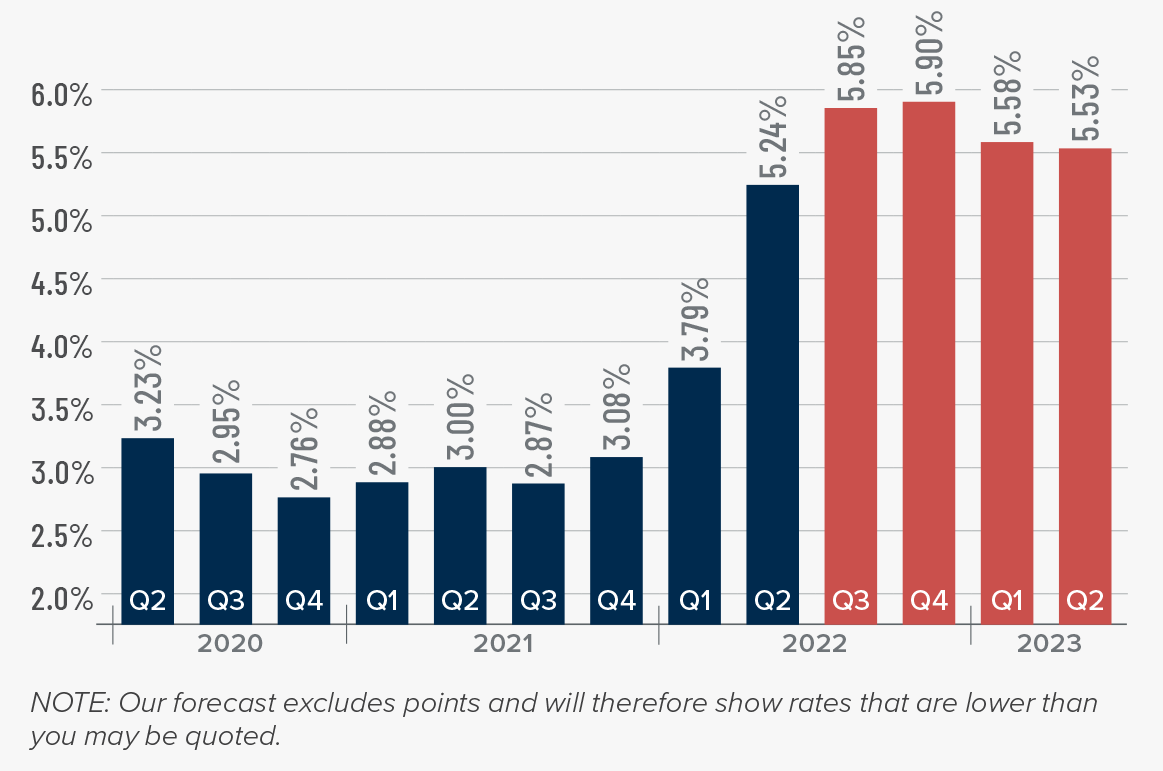
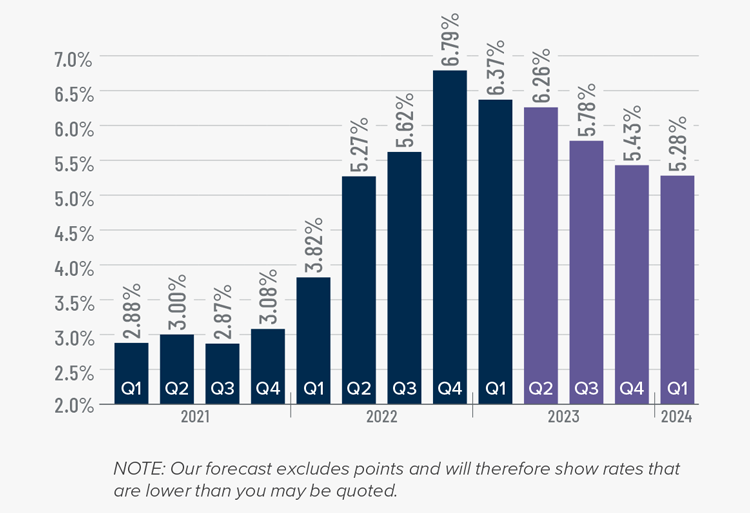
Rates in the first quarter of 2023 were far less volatile than last year, even with the brief but significant impact of early March’s banking crisis. It appears that buyers are jumping in when rates dip, which was the case in mid-January and again in early February.
Even with the March Consumer Price Index report showing inflation slowing, I still expect the Federal Reserve to raise short-term rates one more time following their May meeting before pausing rate increases. This should be the catalyst that allows mortgage rates to start trending lower at a more consistent pace than we have seen so far this year. My current forecast is that rates will continue to move lower with occasional spikes, and that they will hold below 6% in the second half of this year.
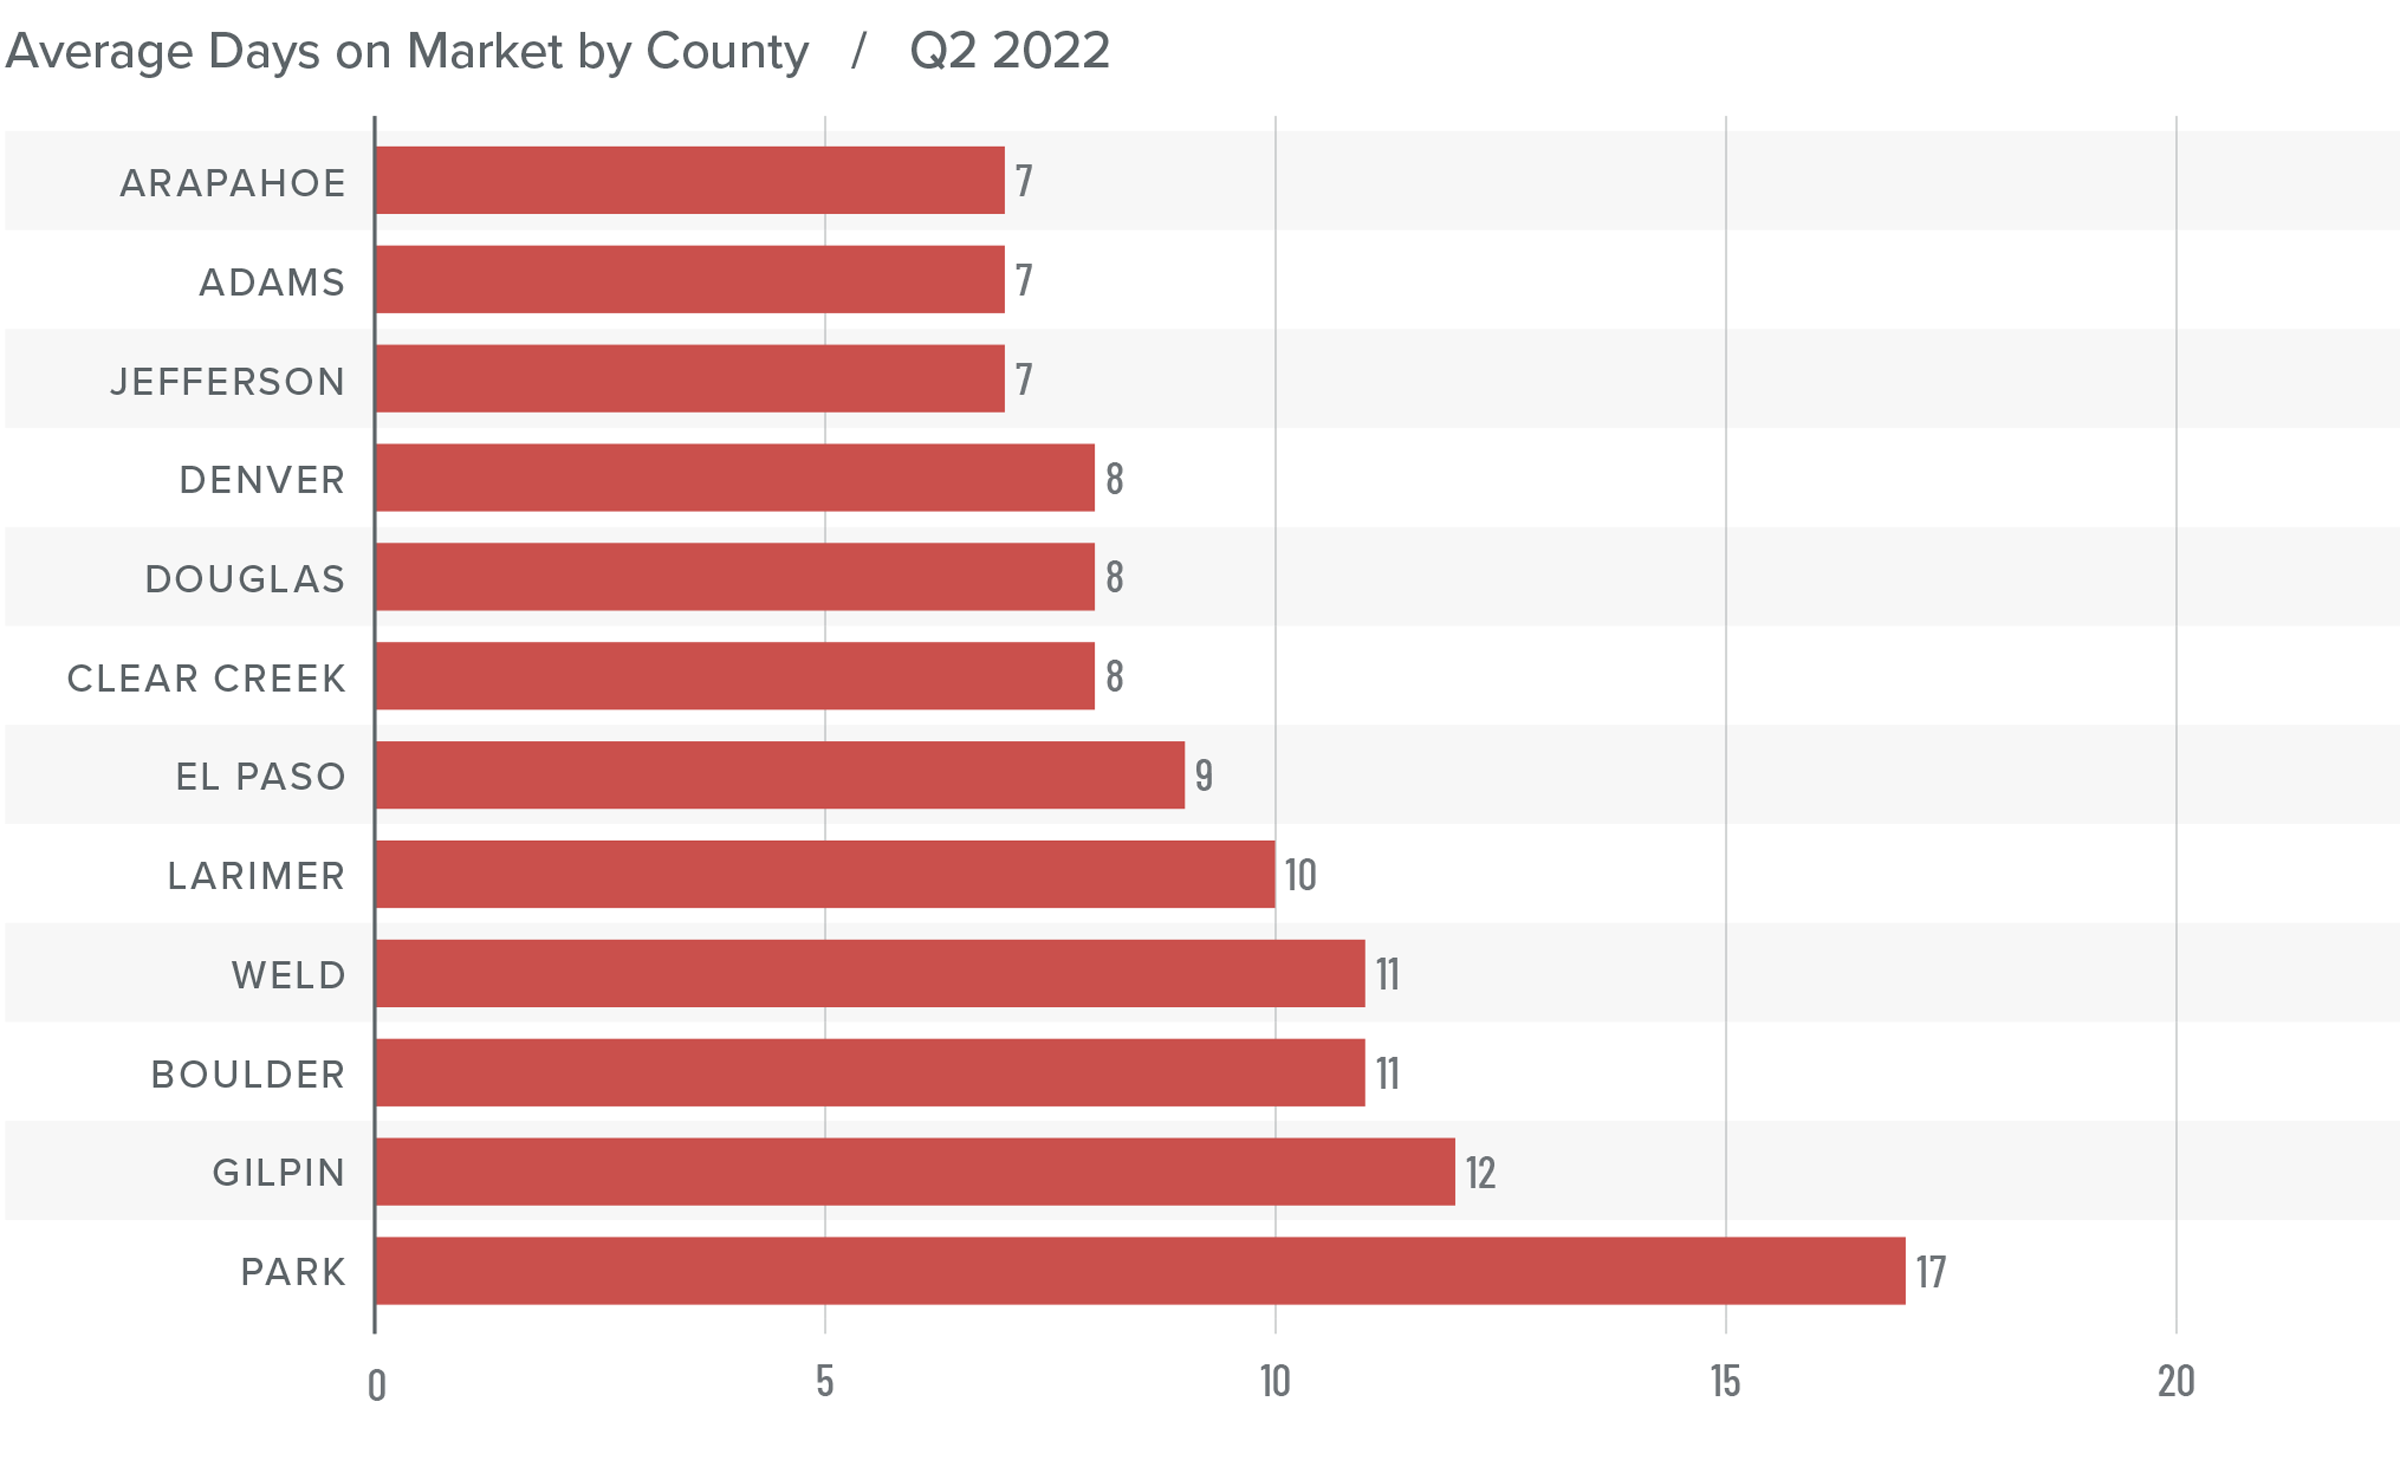
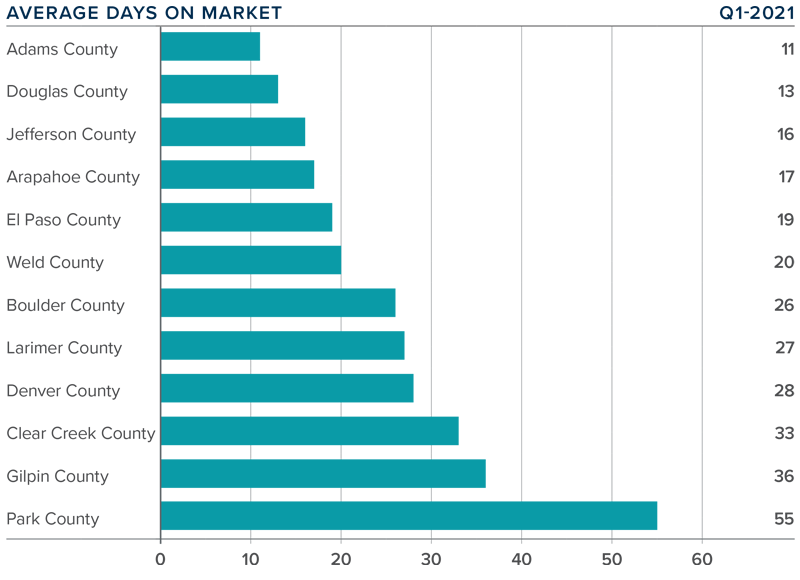
Colorado Days on Market
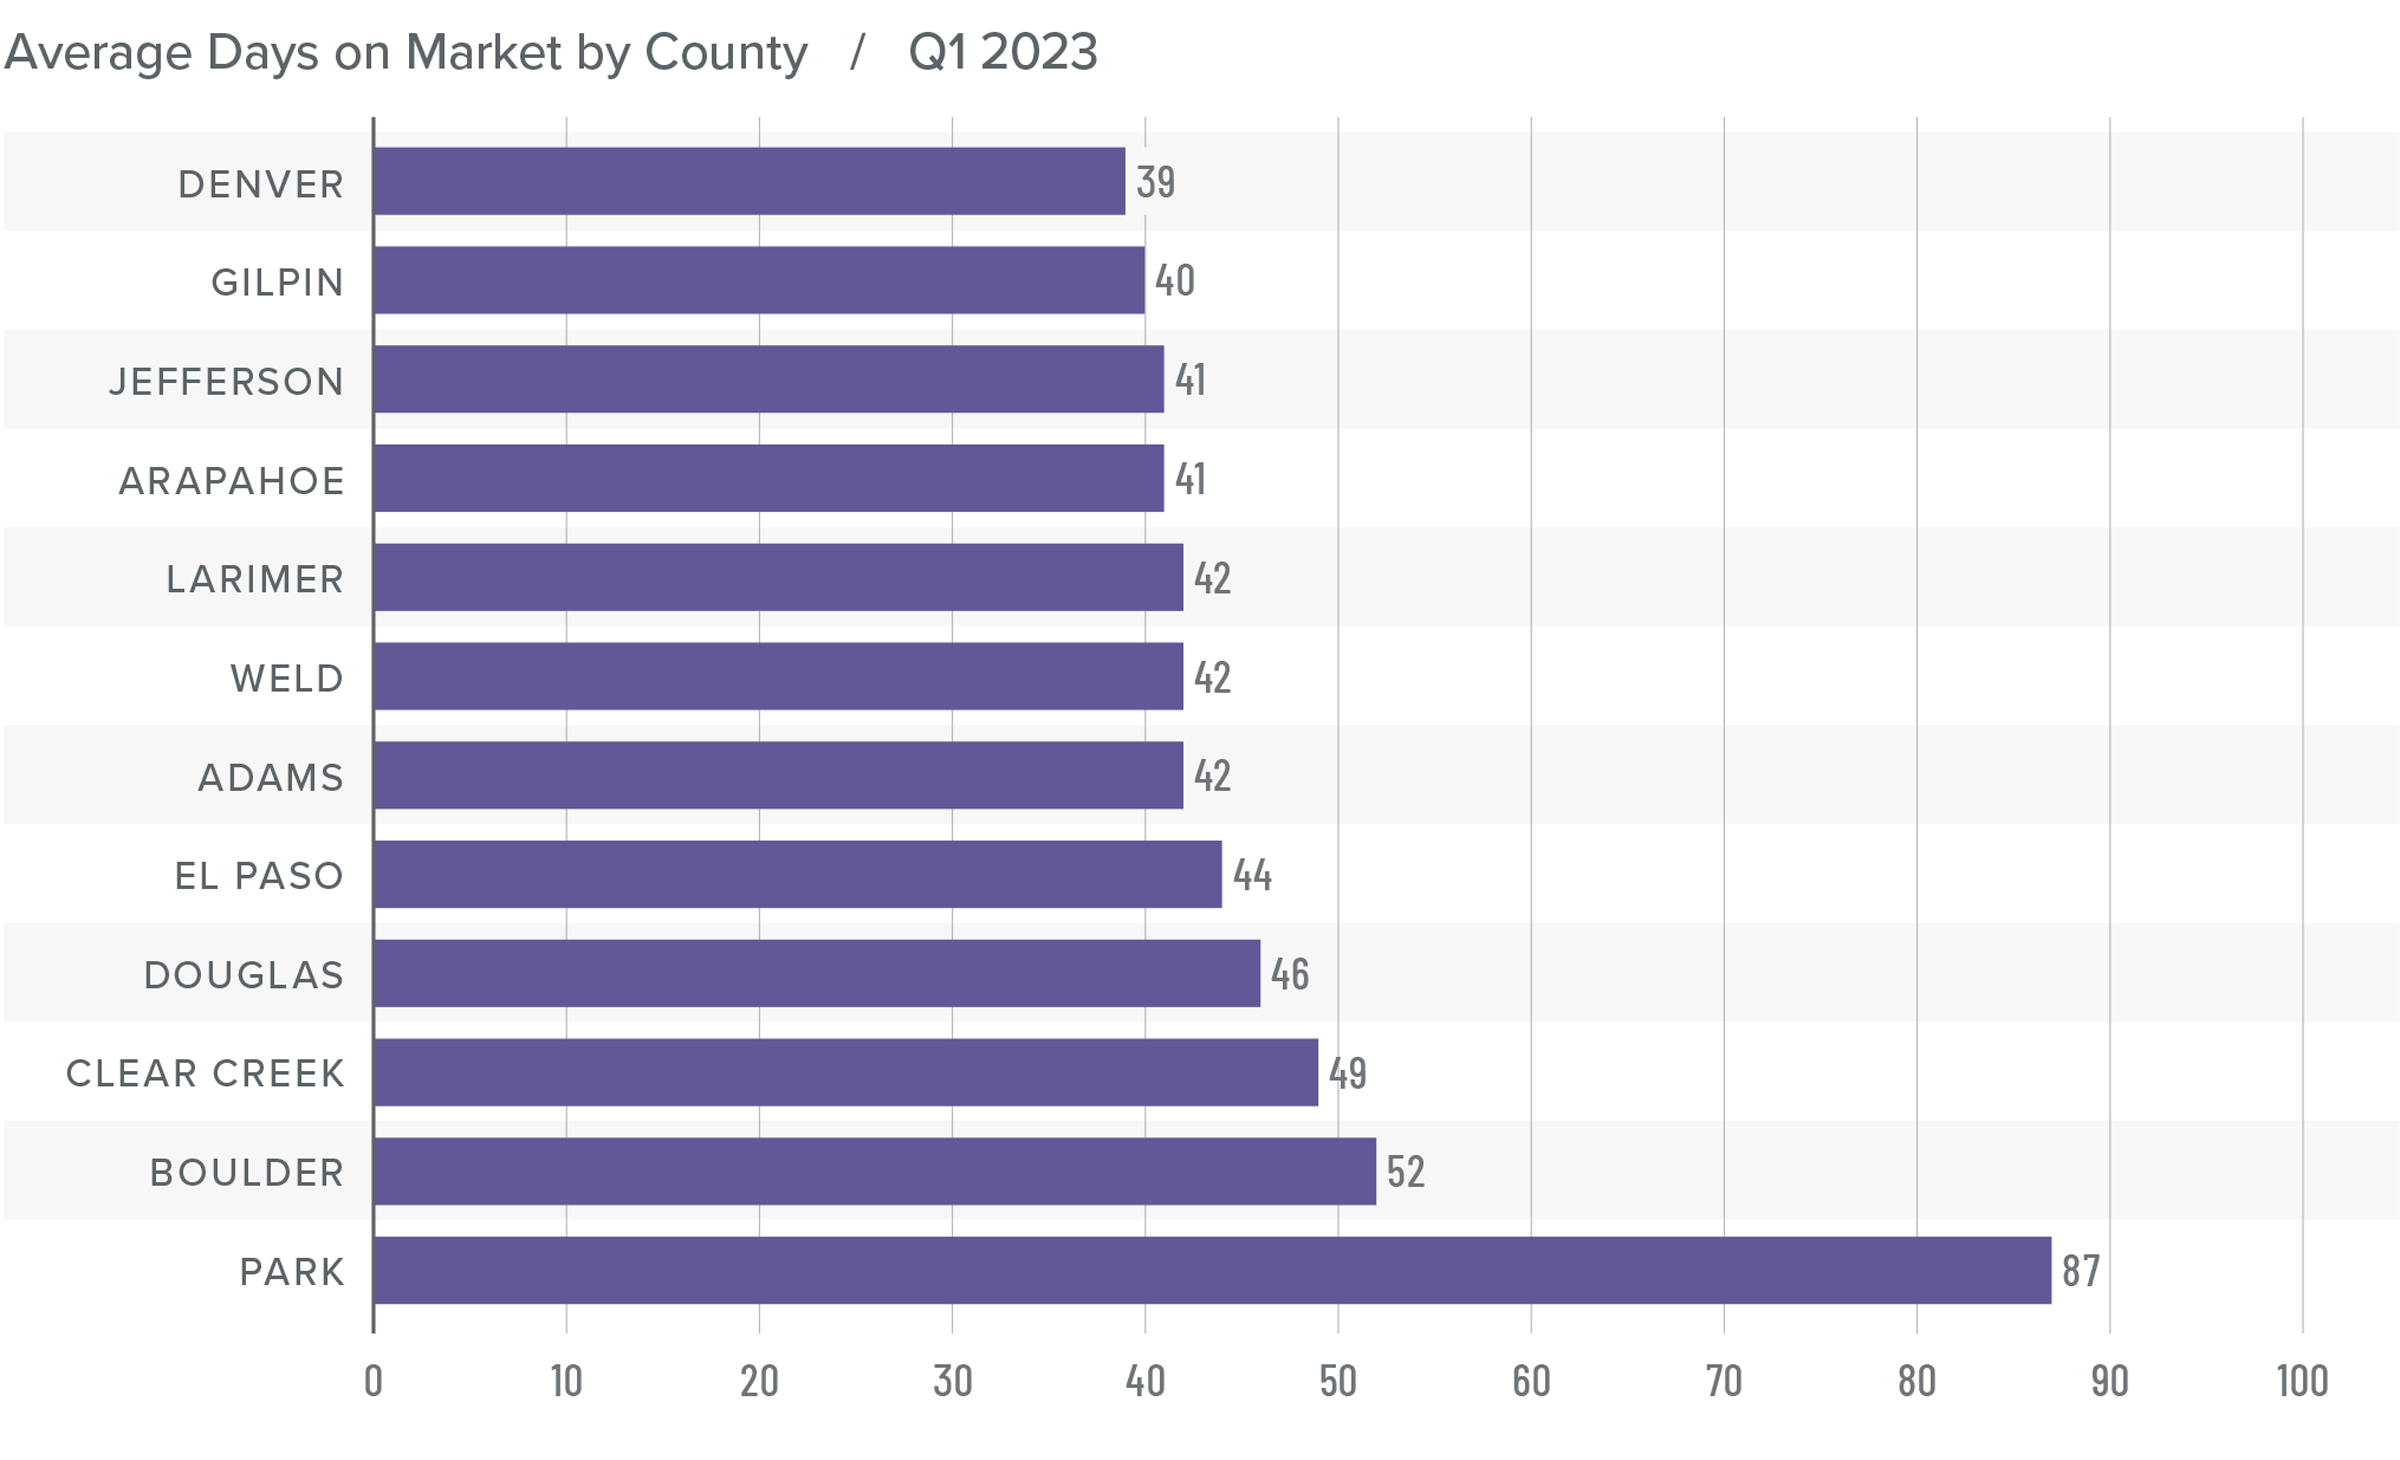
❱ The average time it took to sell a home in the markets contained in this report rose 27 days compared to the same period in 2022.
❱ The length of time it took to sell a home rose across all markets compared to the fourth quarter of 2022 with the exception of Clear Creek County, where market time fell 13 days.
❱ It took an average of 47 days to sell a home in the region, which is an increase of 9 days compared to the fourth quarter of 2022.
❱ Even with limited choice in the market, buyers are being selective and taking their time. It will be interesting to see if the pace of sales picks up as we move further into the spring buying season.
Conclusions
This speedometer reflects the state of the region’s real estate market using housing inventory, price gains, home sales, interest rates, and larger economic factors.
Slowing job growth, the potential for a mild recession this year, and higher financing costs are all impediments to the housing market. However, the market appears to be taking things in stride. Regular readers will be aware that I have been forecasting home prices to soften given all the above factors, which has proved to be accurate. There are signs we may be turning the corner, but we will need to see data from the spring market to confirm if this is the case.
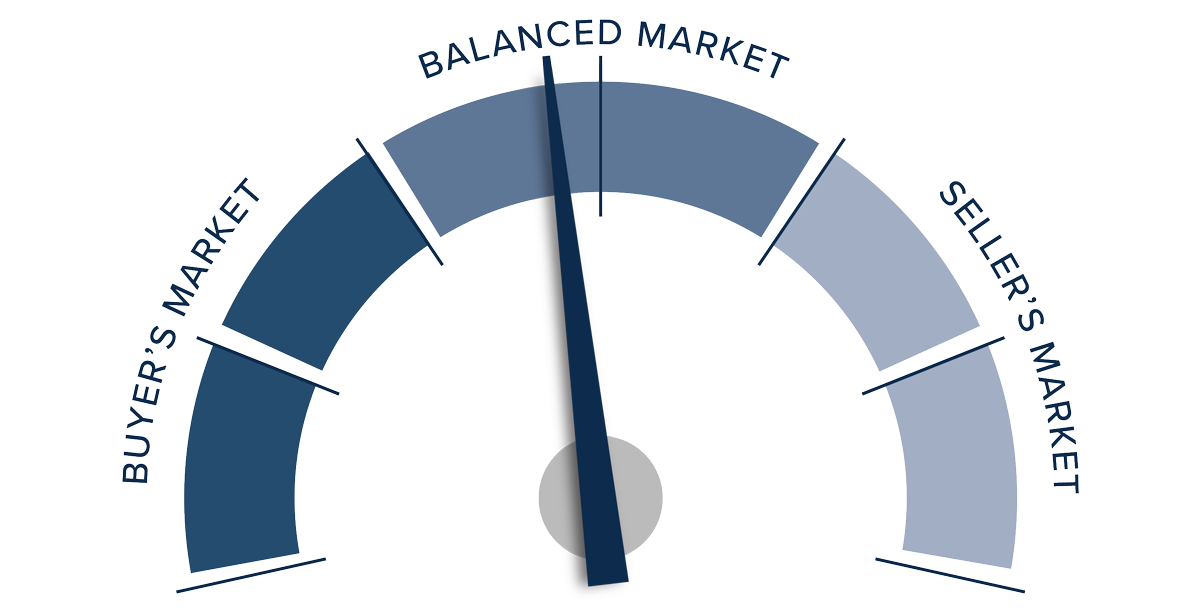
As it stands today, inventory levels, listing prices, pending sales, modestly lower interest rates, and the absorption rate all favor home sellers. However, the number of closed sales, prices, and market time are favoring home buyers. Considering all the data, I do not see the market firmly in favor of either buyers or sellers. However, I see a slight bias in favor of home buyers, so I’ve tipped the needle very slightly in their direction.
About Matthew Gardner

As Chief Economist for Windermere Real Estate, Matthew Gardner is responsible for analyzing and interpreting economic data and its impact on the real estate market on both a local and national level. Matthew has over 30 years of professional experience both in the U.S. and U.K.
In addition to his day-to-day responsibilities, Matthew sits on the Washington State Governors Council of Economic Advisors; chairs the Board of Trustees at the Washington Center for Real Estate Research at the University of Washington; and is an Advisory Board Member at the Runstad Center for Real Estate Studies at the University of Washington where he also lectures in real estate economics.